

Why a Sports Website Benefits from Live 3D Tracker
How live-match visualization helps users understand the action and complements a conventional score and statistics view.
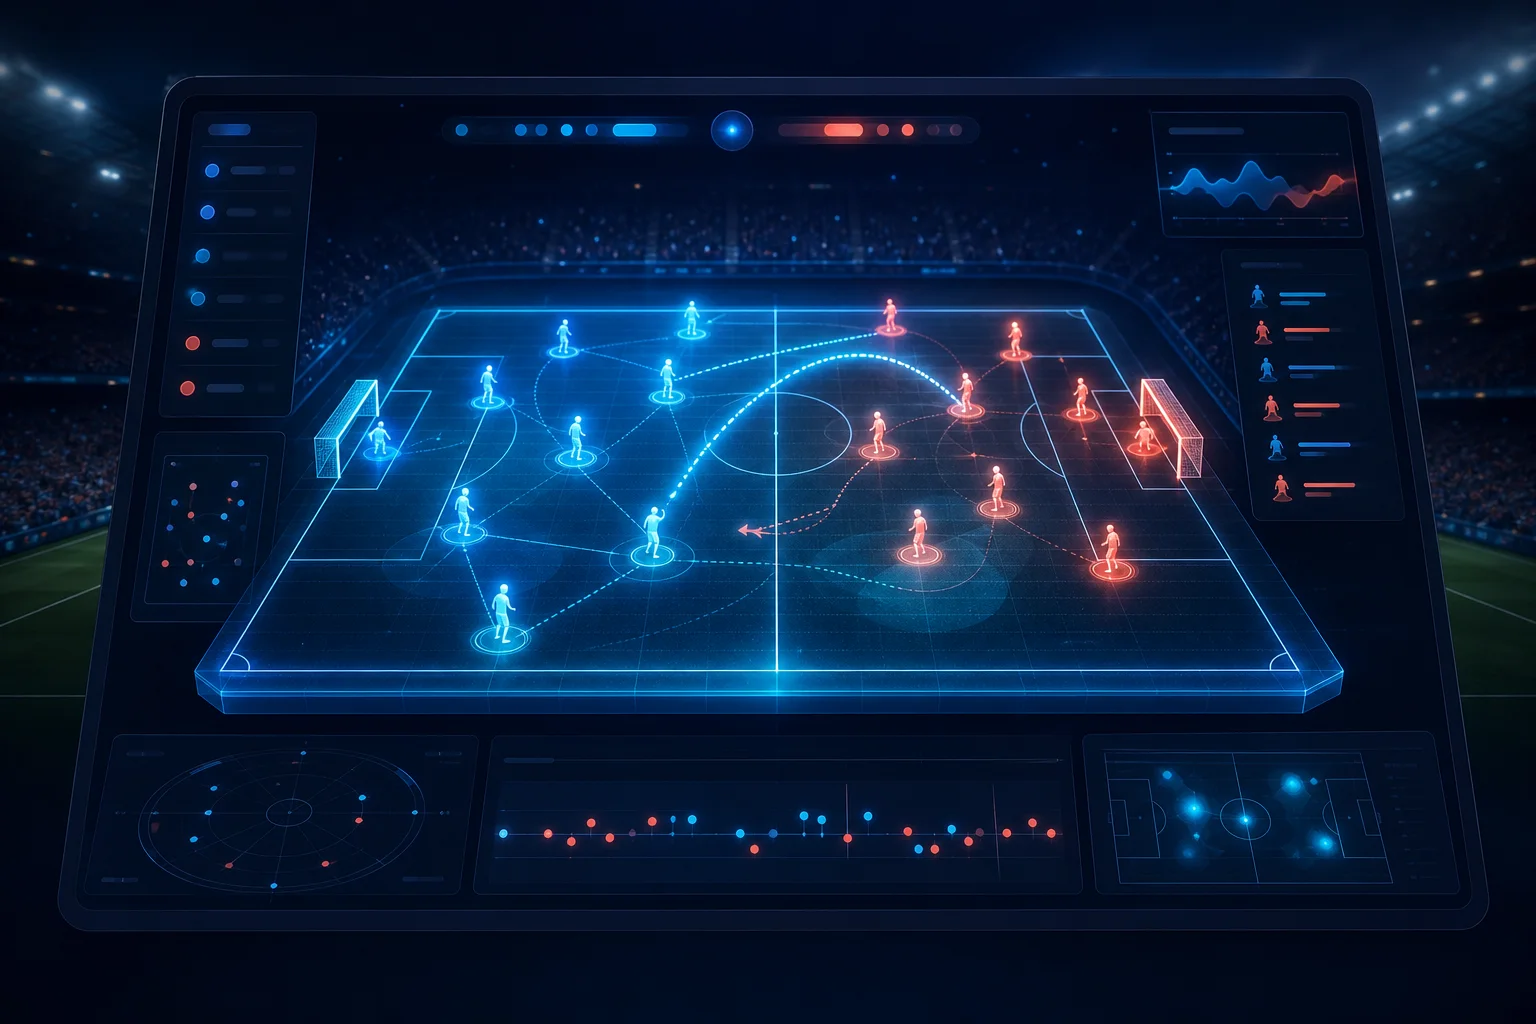
A score is not enough
The line “1–0, 67th minute” communicates the result but not the rhythm of the match. A user cannot see where the ball is, which team is attacking, or why a moment is dangerous. A visual tracker turns technical coordinates and event signals into an understandable scene.
This is especially useful when a video stream is unavailable or requires a separate license. A tracker does not replace video, but it preserves match context and makes a live section useful on its own.
How the tracker connects to the sports line
The widget does not provide a match list. The website retrieves an event from the sports line, checks its live status and visualization identifier, and only then starts Live 3D Tracker.
Widget parameters and the integration sequence are covered in the tracker integration guide. The selected event is based on the Sport Line API match model.
What the user gains
A well-integrated tracker helps users:
- see the direction of an attack;
- notice a dangerous moment sooner;
- retain context while switching matches;
- understand statistical changes as part of the action;
- stay engaged with the live section for longer.
The animation is only one part of the experience. The block must load quickly, work on mobile devices, and avoid leaving an empty area when visualization is unavailable.
When to display the tracker
Before creating the widget, verify three conditions: the match is live, the plan supports the sport, and the visualization identifier is not null. If any condition fails, display statistics instead or hide the block cleanly.
This makes the tracker a useful continuation of the match data rather than a decorative page element.