

Sports statistics widget for 16 sports on your website
Today's matches, xG, line-ups, standings, H2H and AI-powered match analytics in one ready-made widget. Embed it with one line of code — the data updates itself.
- 16 sports
- 11 screen types
- Dark and light themes
- 36 interface languages
Sports covered by the widget
- Football
- Ice hockey
- Basketball
- Tennis
- Baseball
- Volleyball
- Handball
- Table tennis
- Futsal
- Beach soccer
- Formula 1
- Australian rules football
- Beach volleyball
- Snooker
- Cricket
- Kabaddi
How the widget breaks down a match
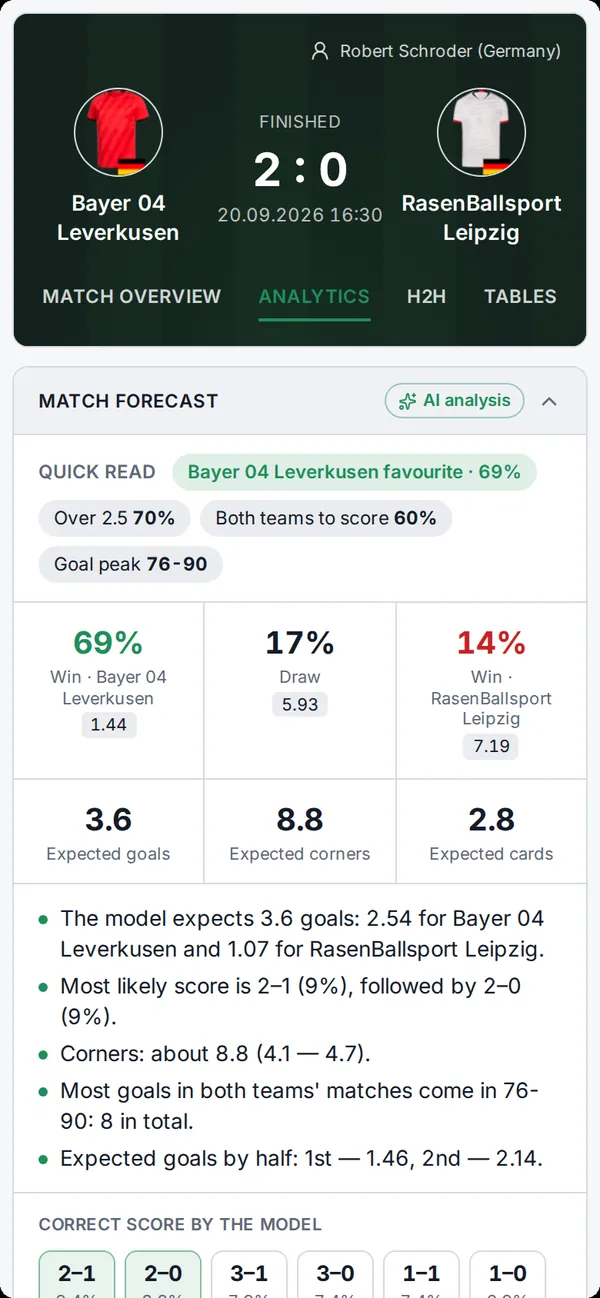
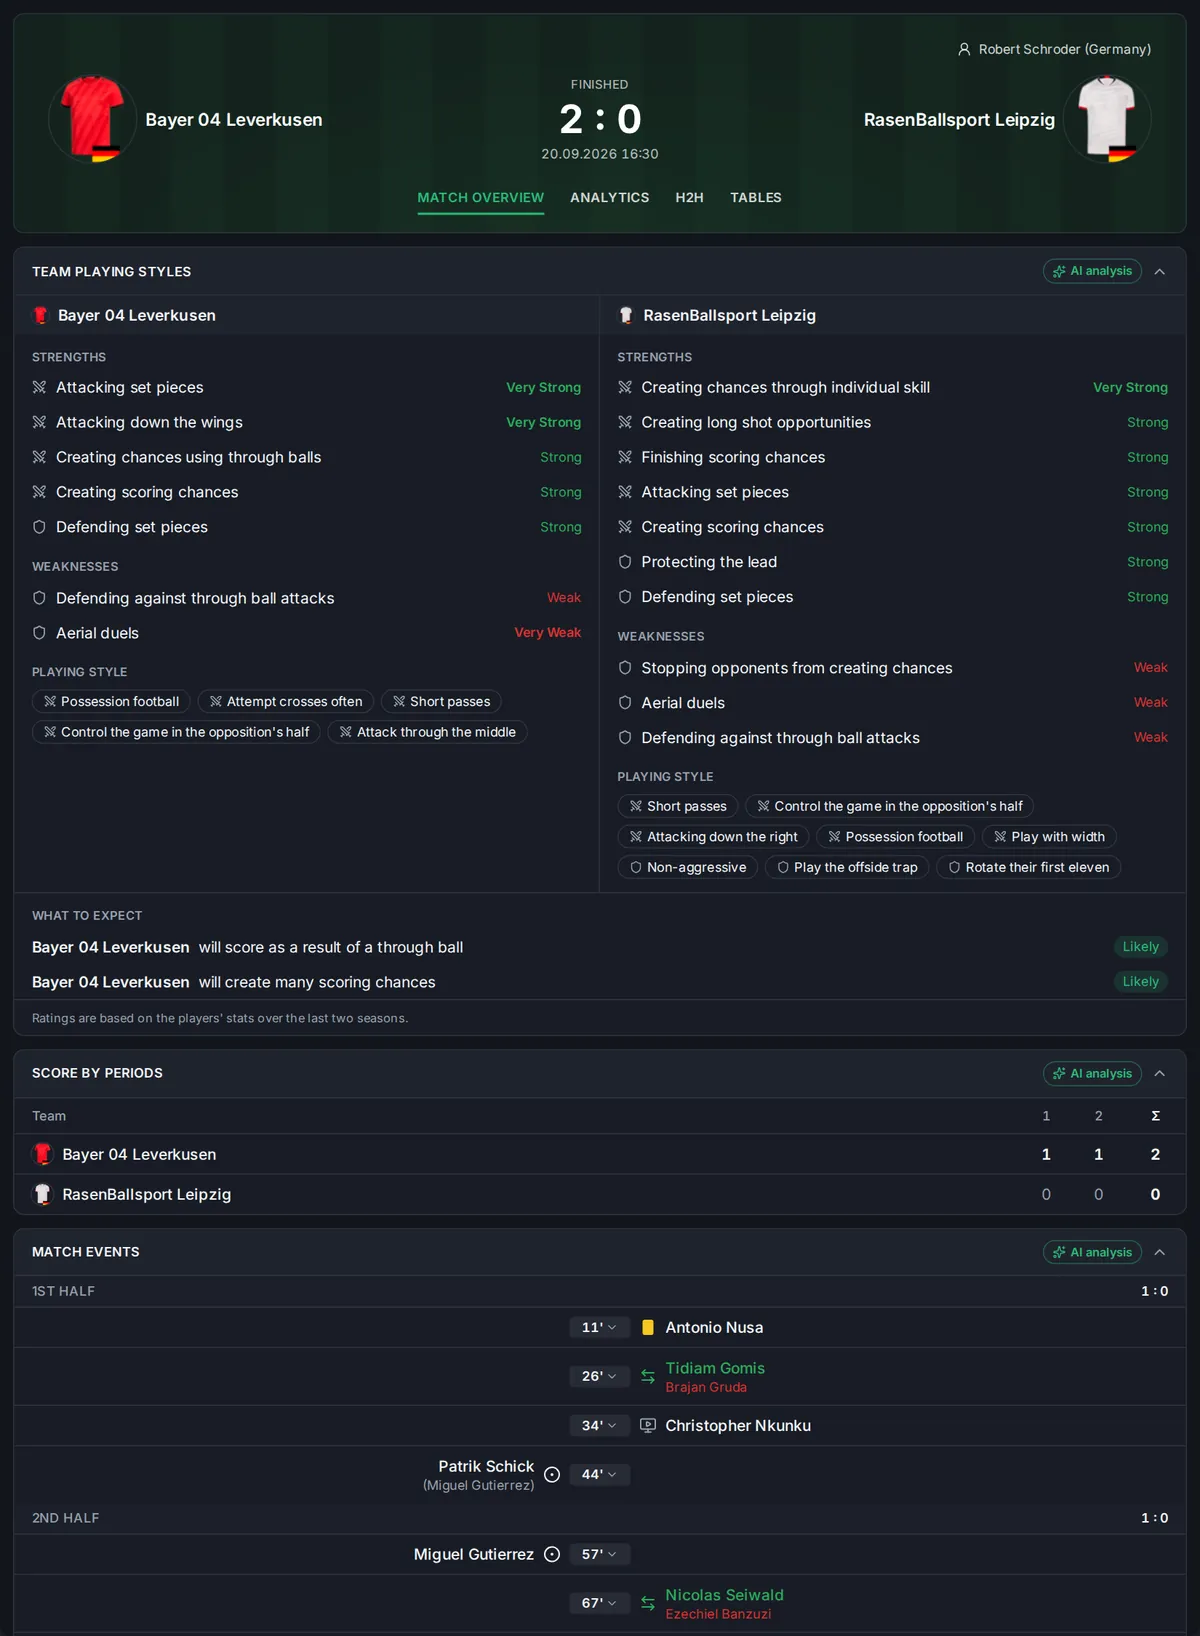
Real data from the widget: Bundesliga, 20 September 2026. Everything you see below, your readers will see on your site — for every match of the day.
- 44' Patrik Schick · Miguel Gutierrez
- 57' Miguel Gutierrez
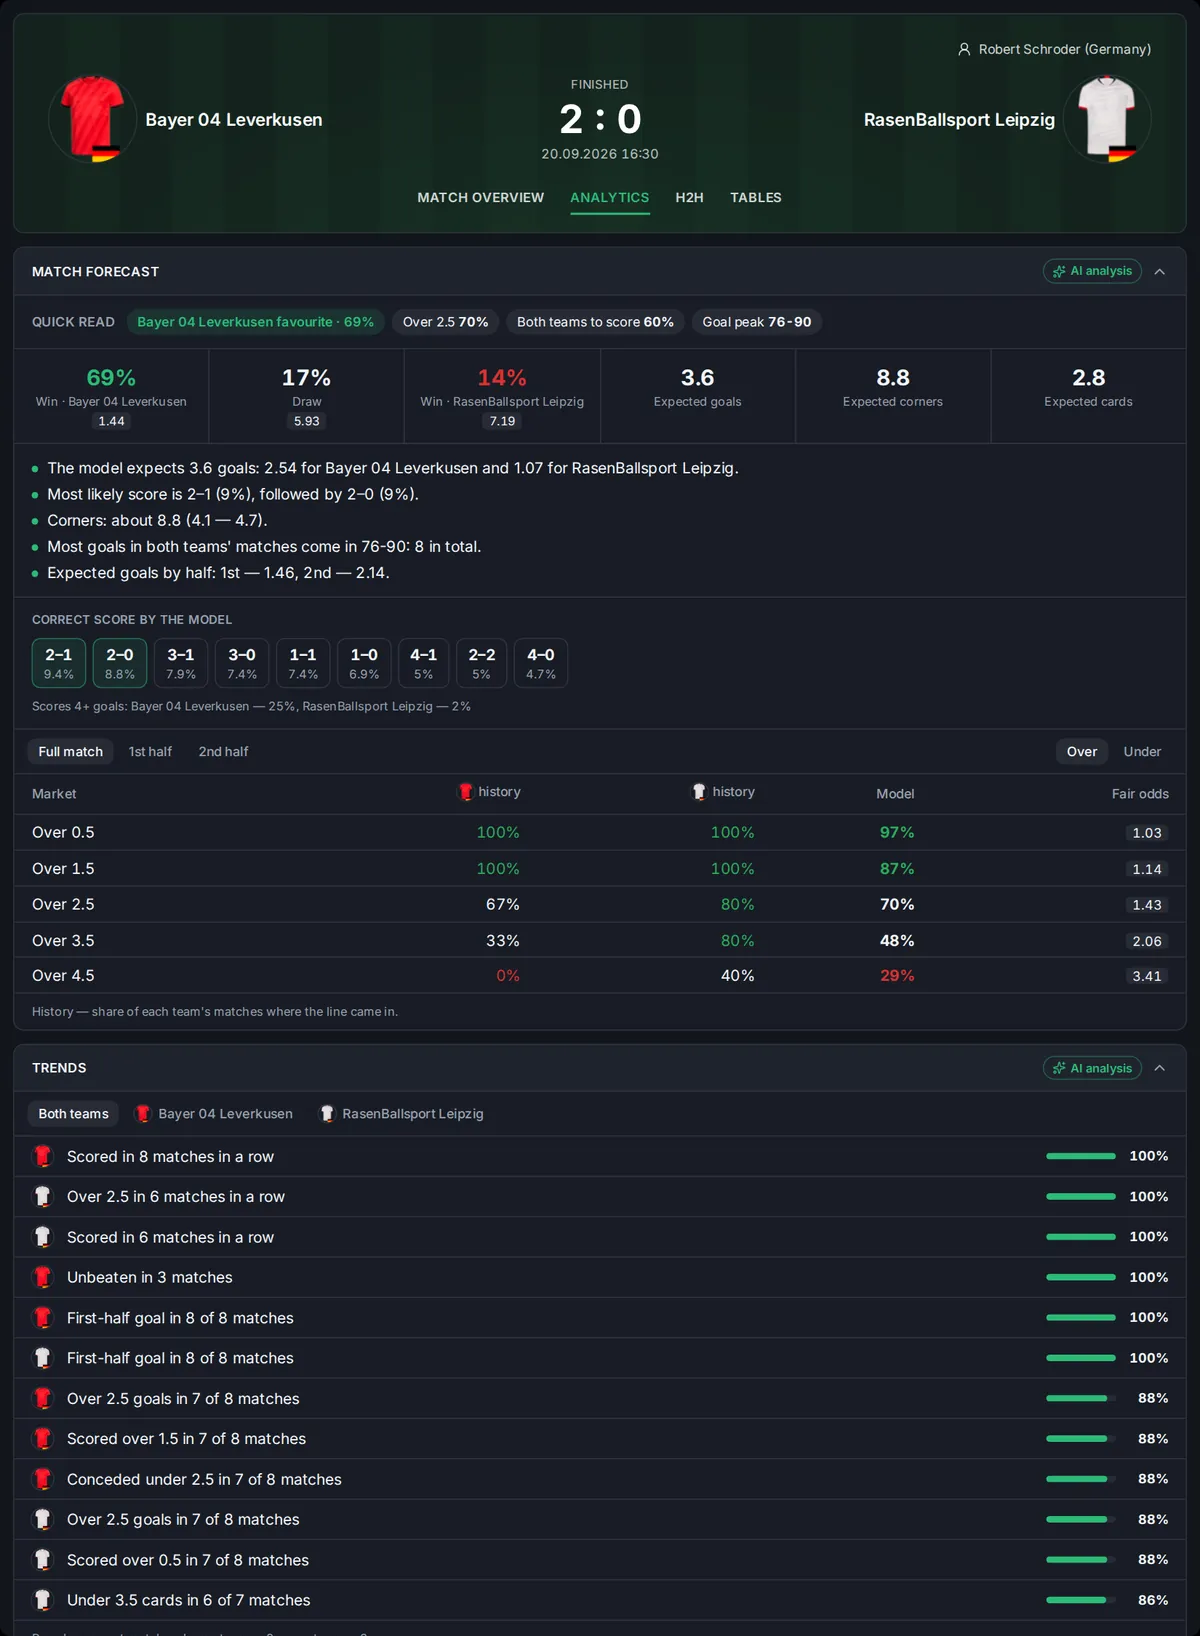
fair odds, no bookmaker margin
Correct score by the model
- 2–1 9.4%
- 2–0 8.8%
- 3–1 7.9%
- 3–0 7.4%
- 1–1 7.4%
- 1–0 6.9%
Final score 2:0 was the model's second most likely score.
- The model expects 3.6 goals: 2.54 for Leverkusen and 1.07 for Leipzig.
- Most goals in both teams' matches come in the 76–90 minute window.
- Over 2.5 — 70%, both teams to score — 60%.
- 2.26 Expected goals (xG) 0.97
- 2.16 Expected goals on target (xGOT) 0.46
- 51 Possession, % 49
- 18 Total shots 12
- 6 Shots on target 3
- 5 Big chances 0
- 31 Touches in opposition box 14
- 9 Corners 6
- B Leverkusen have scored in 8 straight matches 100%
- L Over 2.5 goals in Leipzig's last 6 matches 100%
- B First-half goal in 8 of 8 matches 100%
- B Over 2.5 goals in 7 of 8 matches 88%
Strengths
- Attacking set pieces — very strong
- Attacking down the wings — very strong
- Chances from through balls — strong
Weaknesses
- Aerial duels — very weak
Data from the SportAPI widget. The forecast is an estimate from SportAPI's own model, not a guaranteed outcome.
What your readers will see
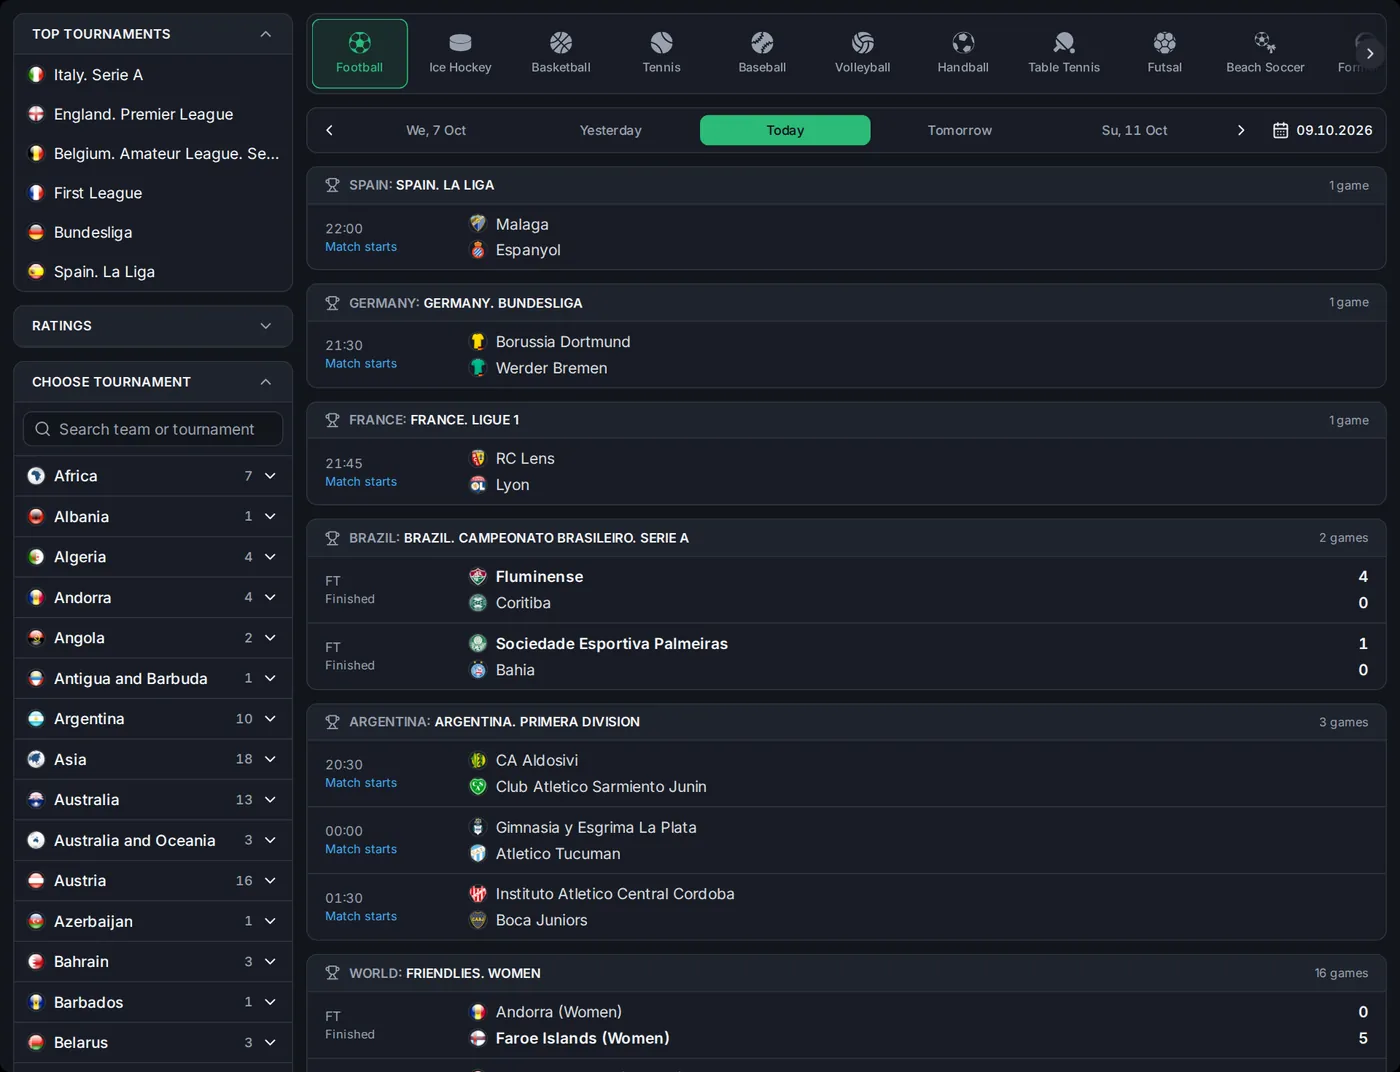
Every screen below is a real screenshot of the widget. Switch tabs to see each one.
Matches of the day across all leagues
A match feed for any date: top competitions, search by team, country or tournament, and quick switching between sports.
- Yesterday, today, tomorrow and a calendar
- Top leagues and every country
- 16 sports in one tab
Match center
Score, minute-by-minute events, team playing styles, line-ups and formations, live commentary and full statistics.
- xG, xGOT, shots, passes, tackles
- Line-ups and formations like 4-2-3-1
- Live text commentary
Match forecast and analytics
Outcome probabilities and fair odds, correct score by the model, totals, trends, markets from recent matches and AI analysis.
- Model vs. history for every total line
- First goal and what happens next, goals by time
- Corners, cards, half-time/full-time
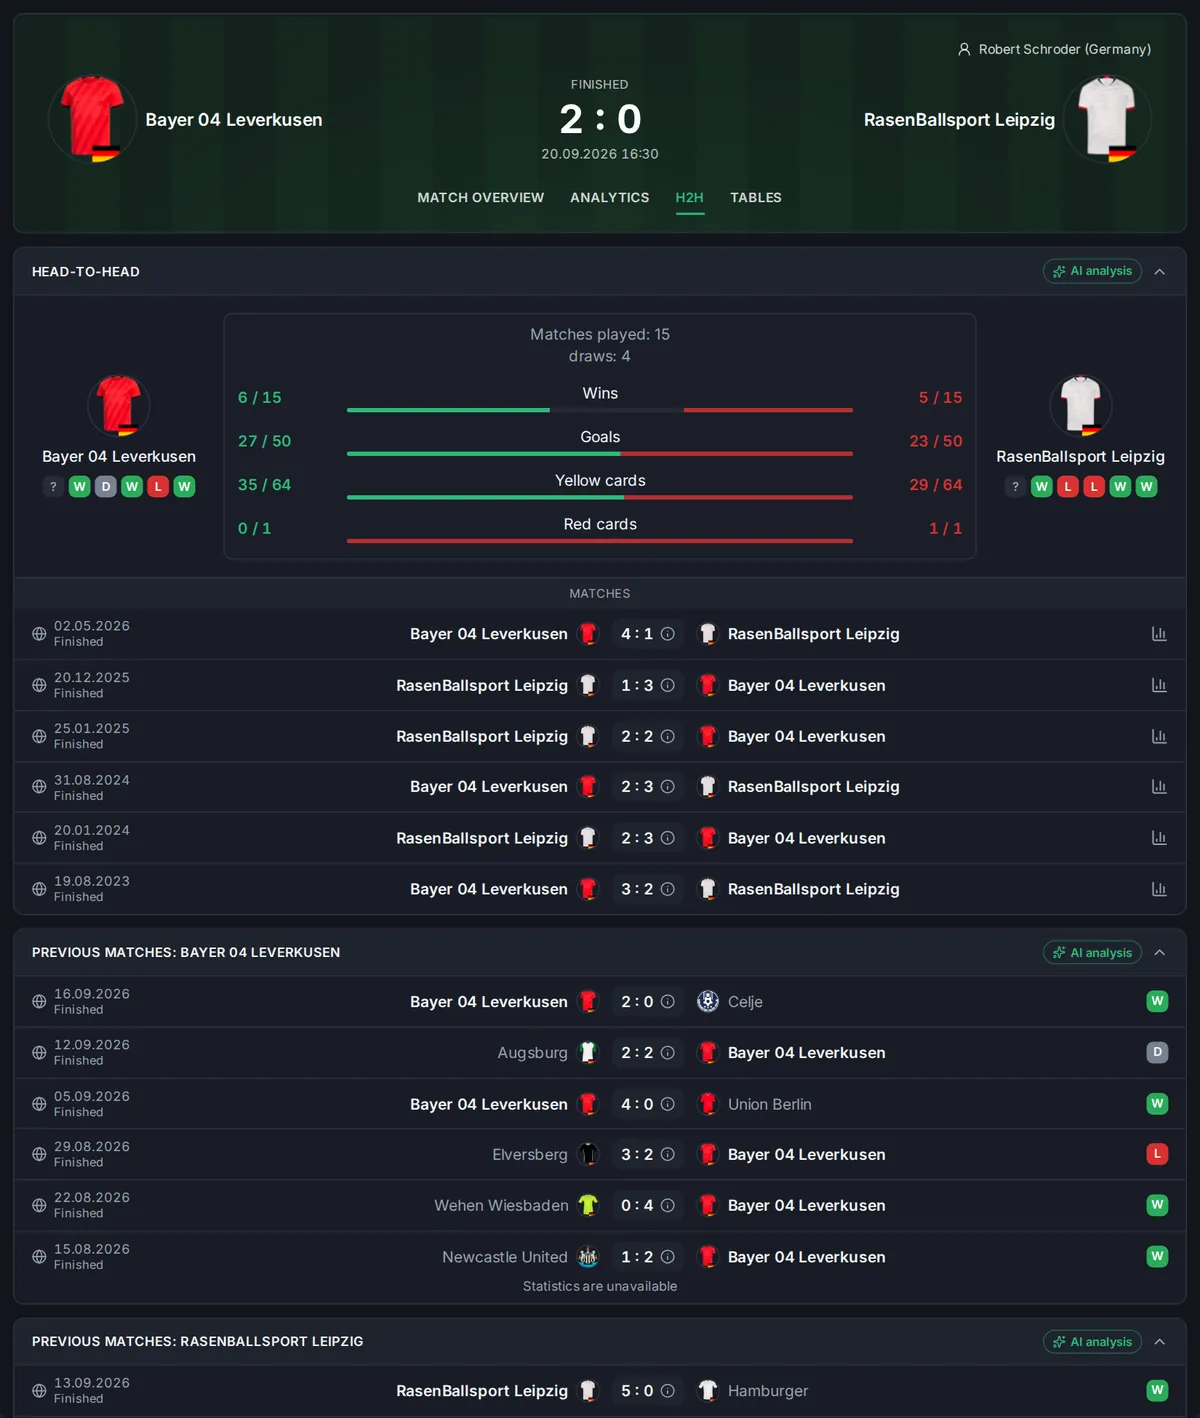
Head-to-head
Previous meetings between the teams, current form and markets in head-to-head matches.
- All head-to-head results
- Recent form
- Goals and totals in direct meetings
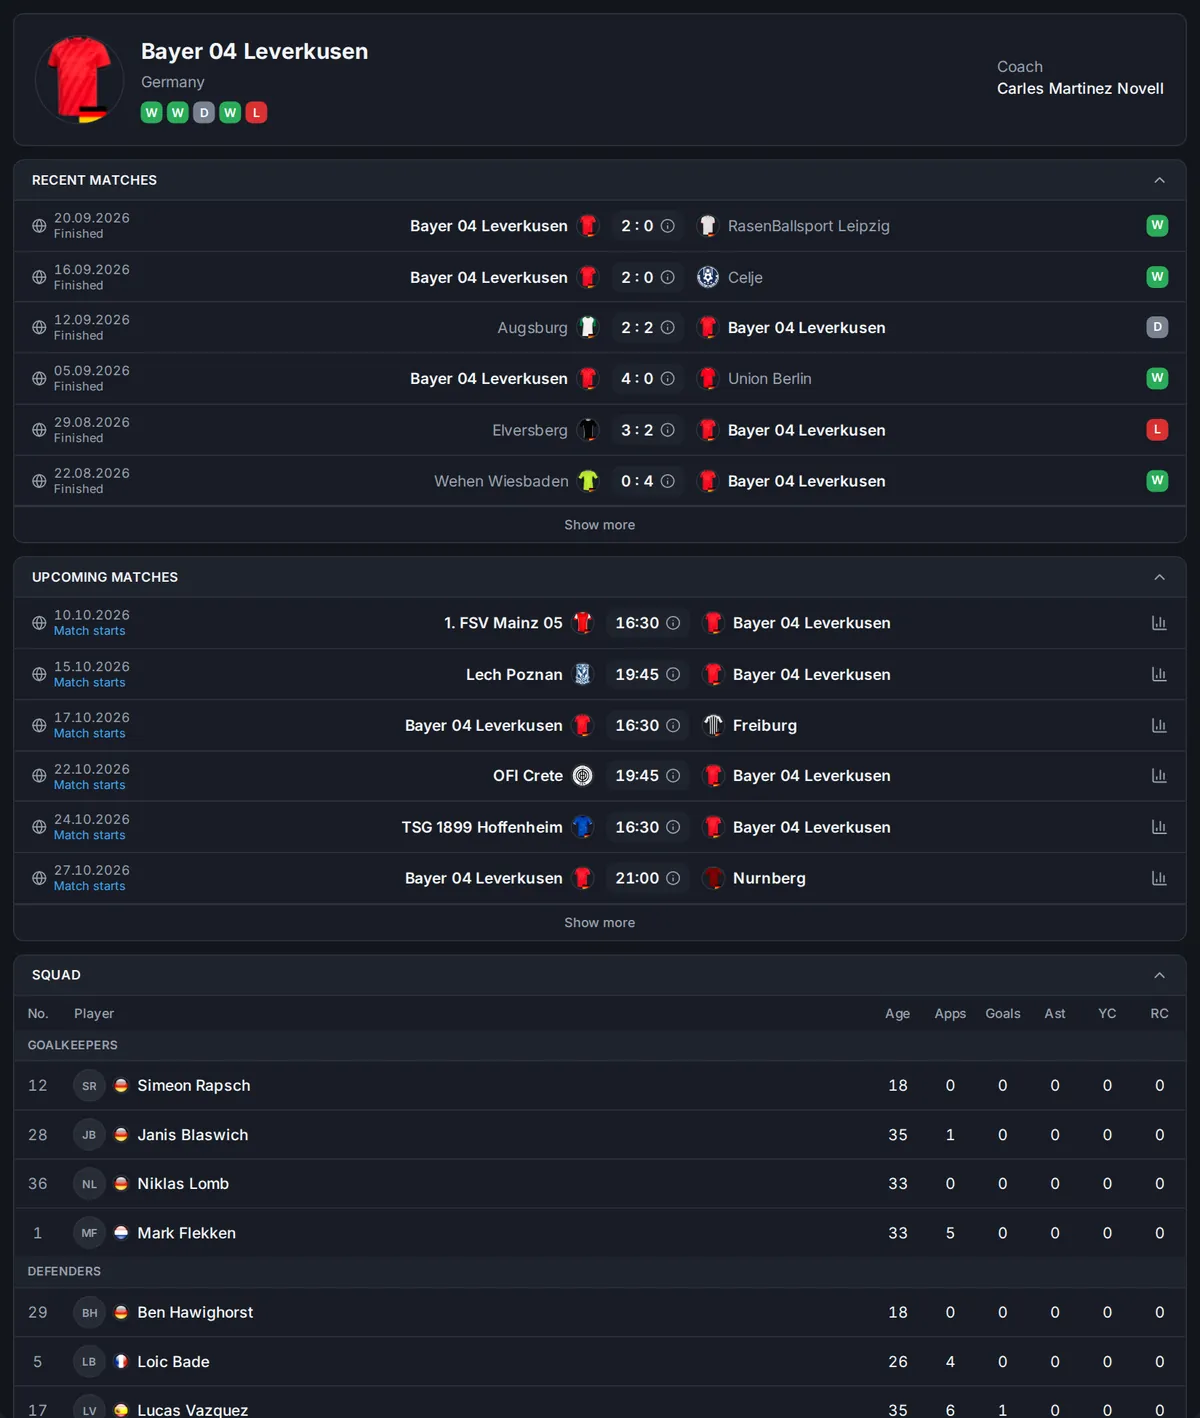
Team page
Recent and upcoming matches, the squad and the team's season statistics.
- Fixtures and results
- Squad with positions
- Season statistics
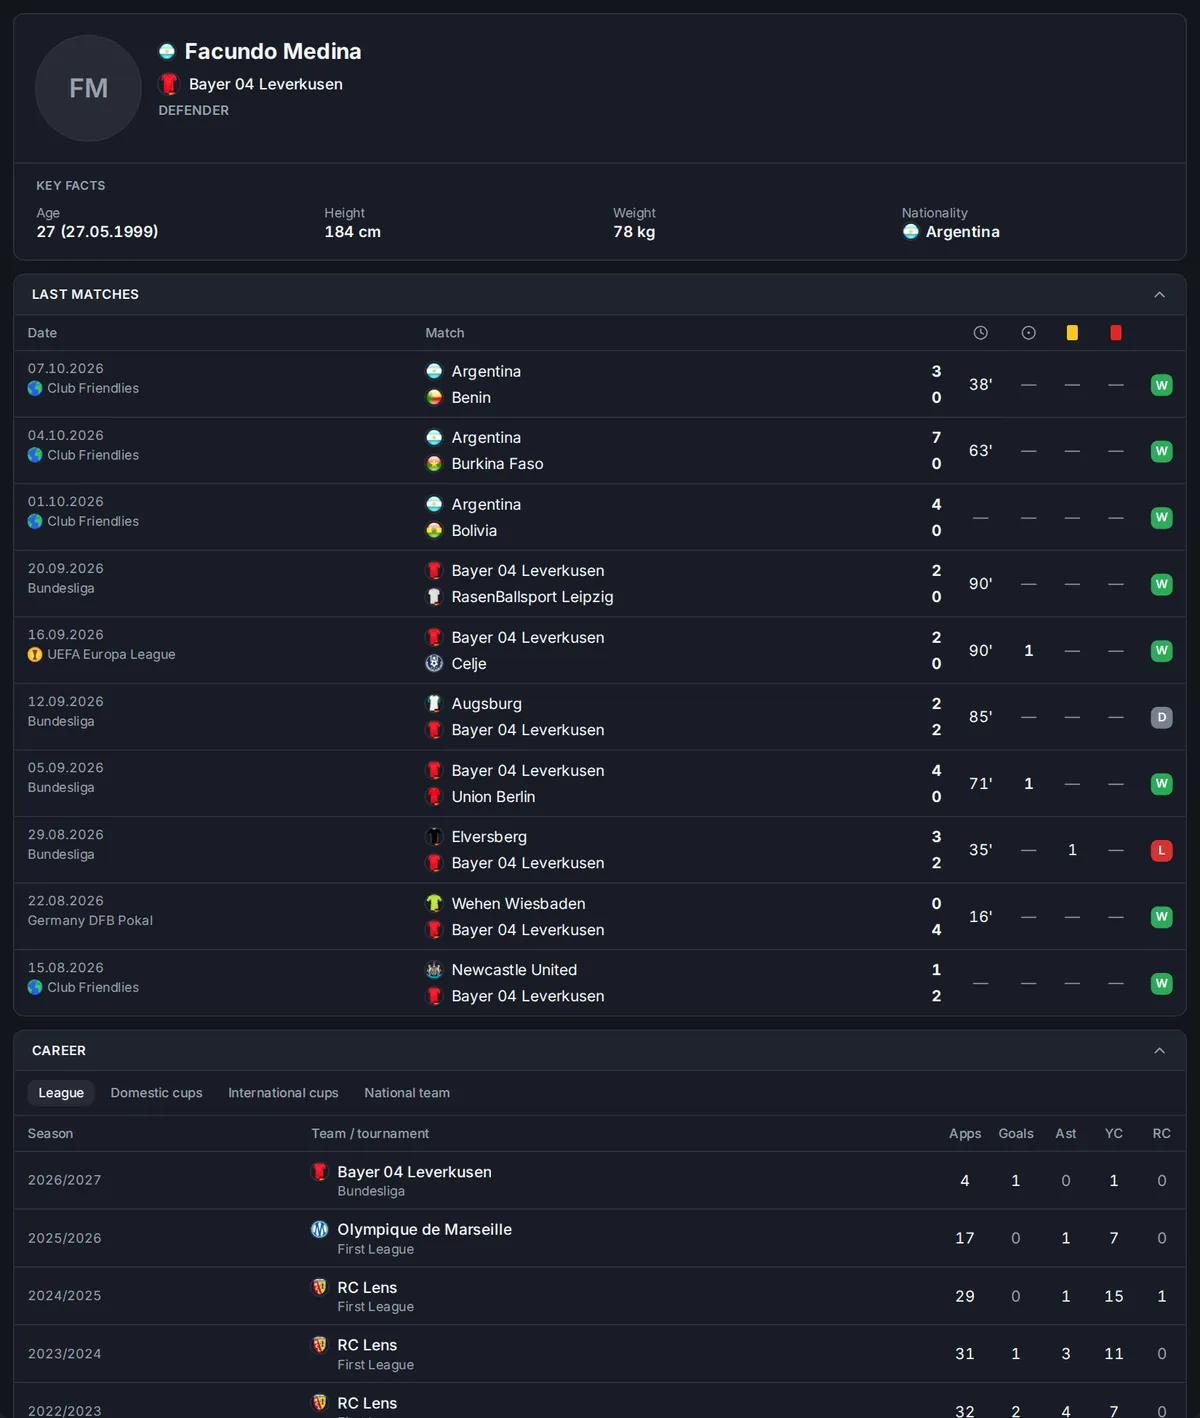
Player profile
Player details and recent matches with minutes played, goals and cards.
- Age, height, position
- Matches and contribution
- Season-by-season history
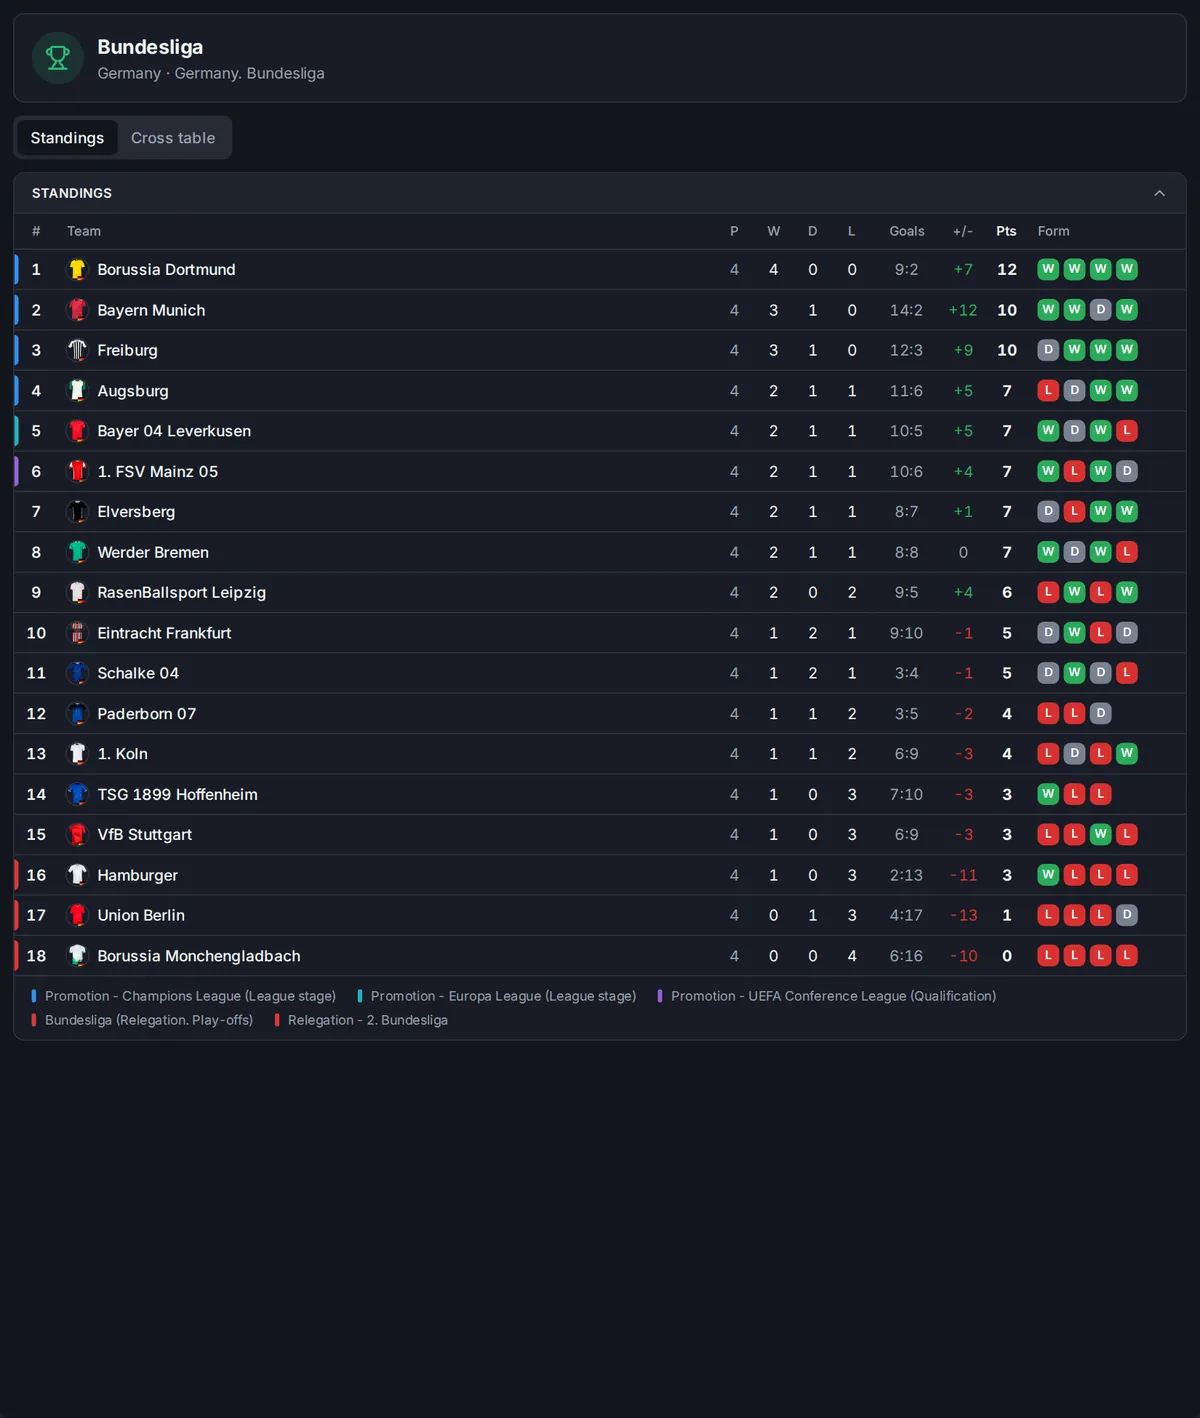
League table and results grid
The league table with team form and a results grid for every round.
- Points, goal difference, form
- Results grid
- European places and relegation zone
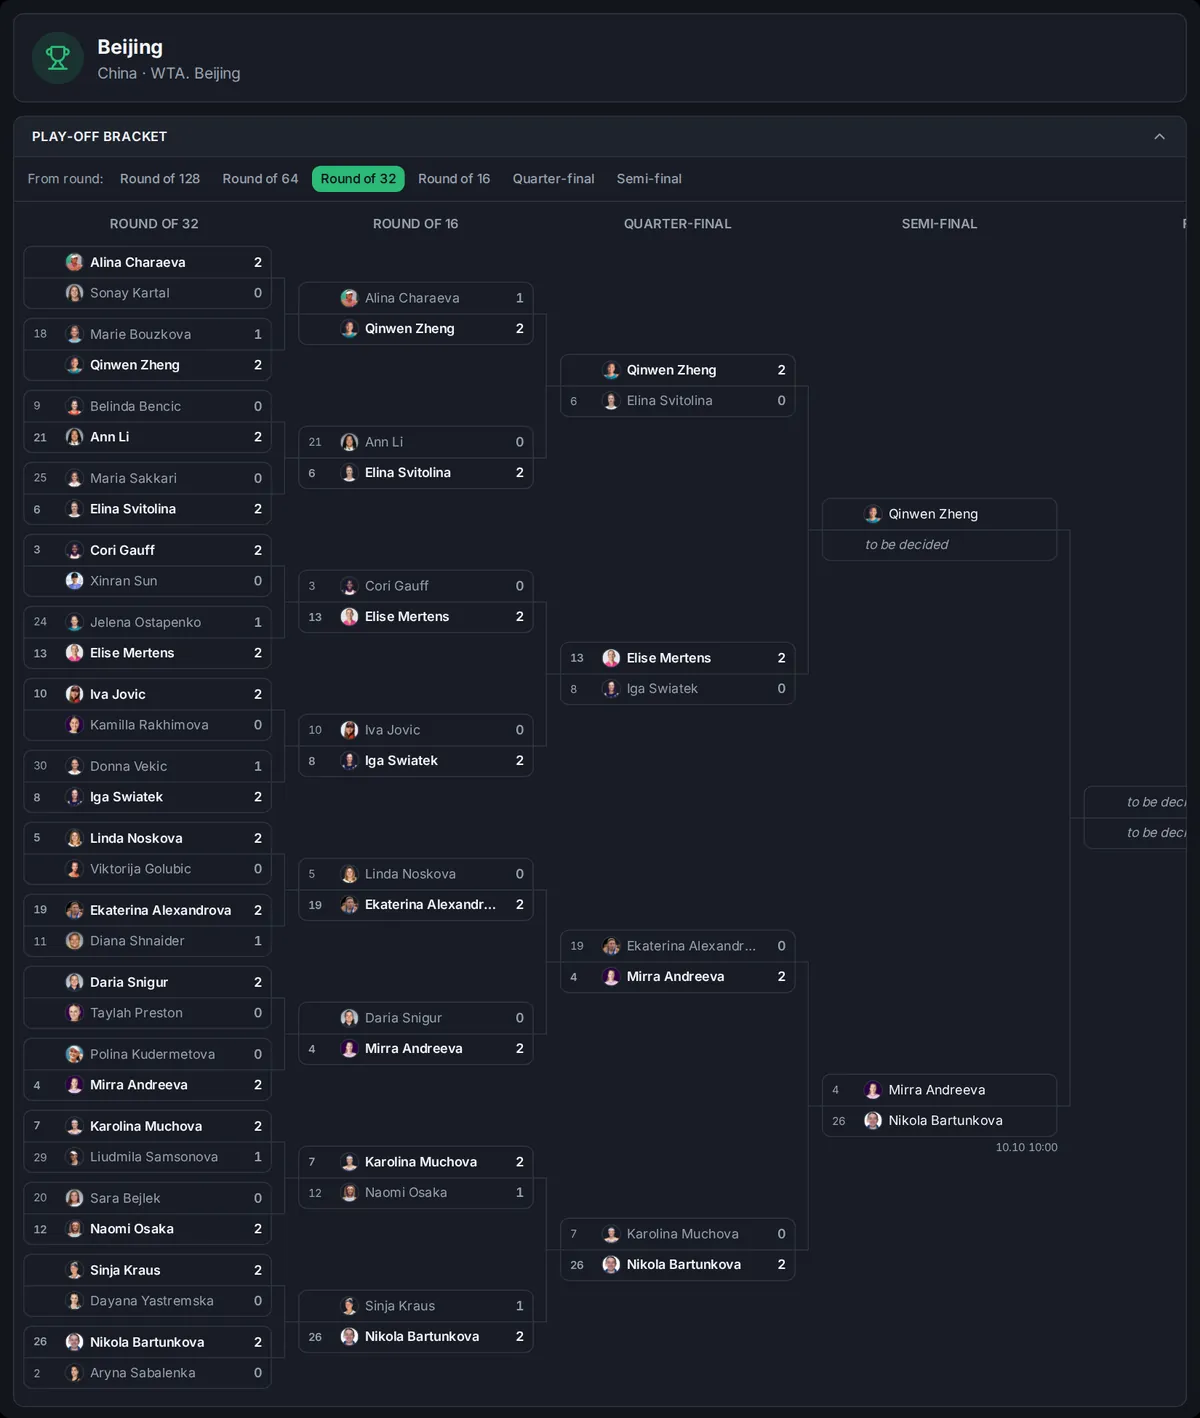
Knockout bracket
A knockout bracket from the first round to the final.
- Every round of the tournament
- Score of each tie
- Tennis, cups and league play-offs
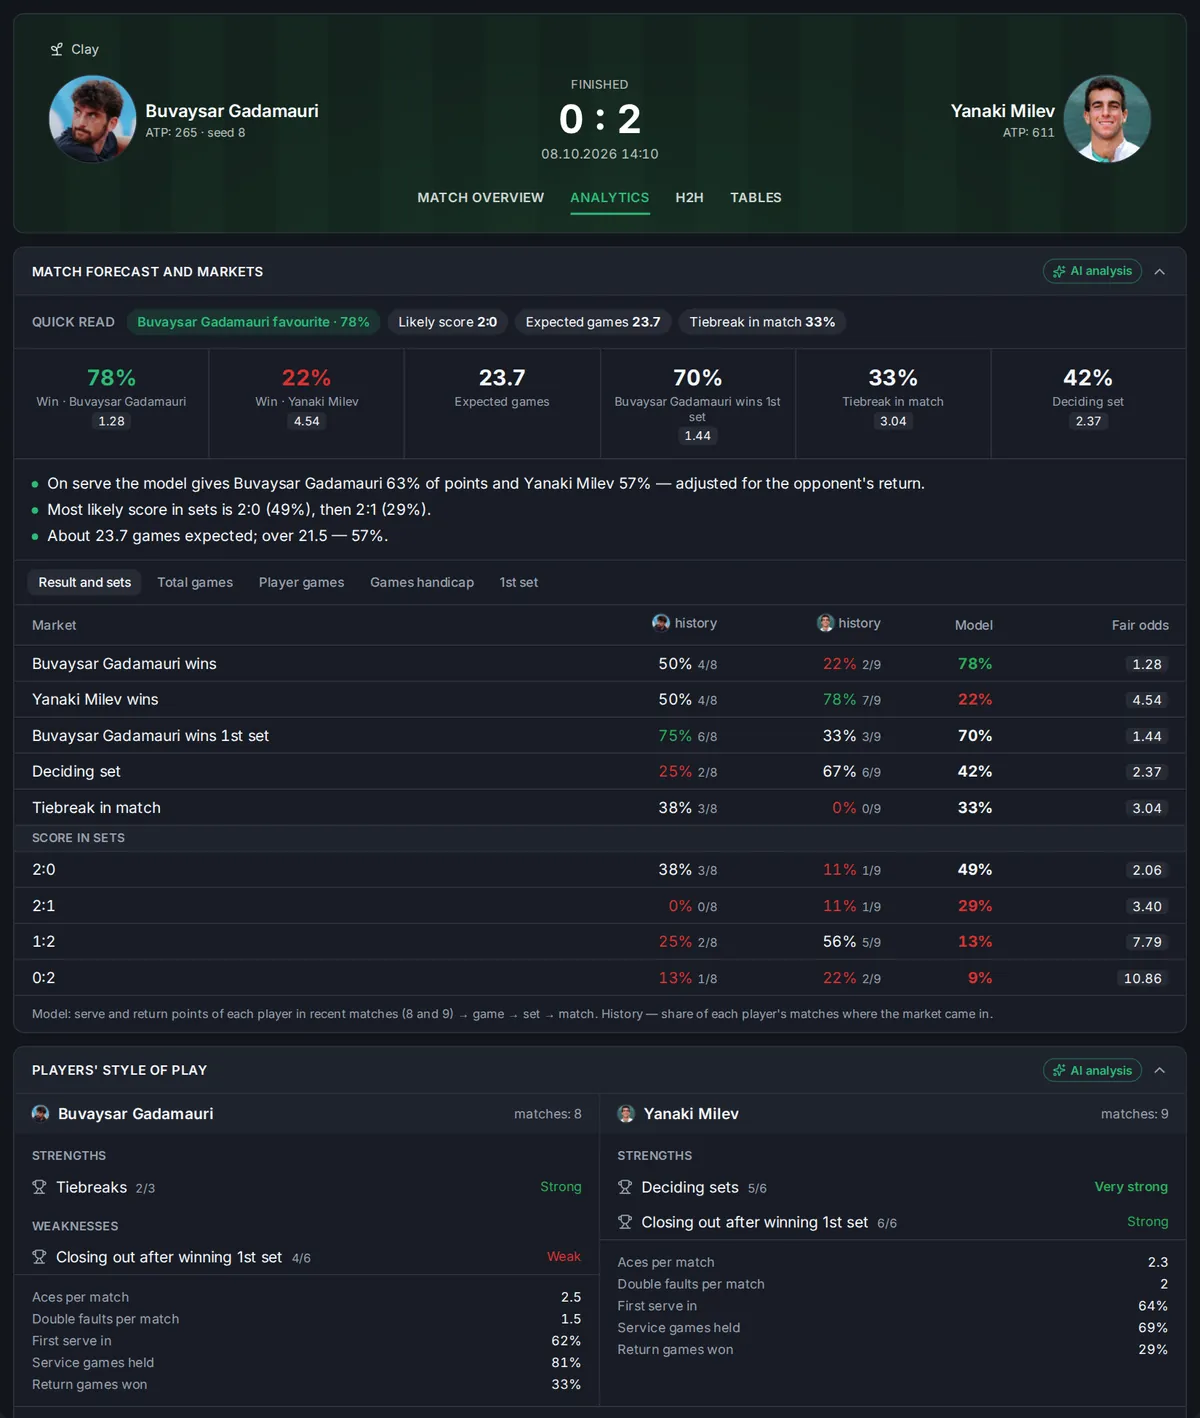
Tennis: win probability
Match and set forecasts, tie-breaks, game totals and each player's style of play.
- Win probability and set scores
- Game totals and tie-breaks
- Serve and return
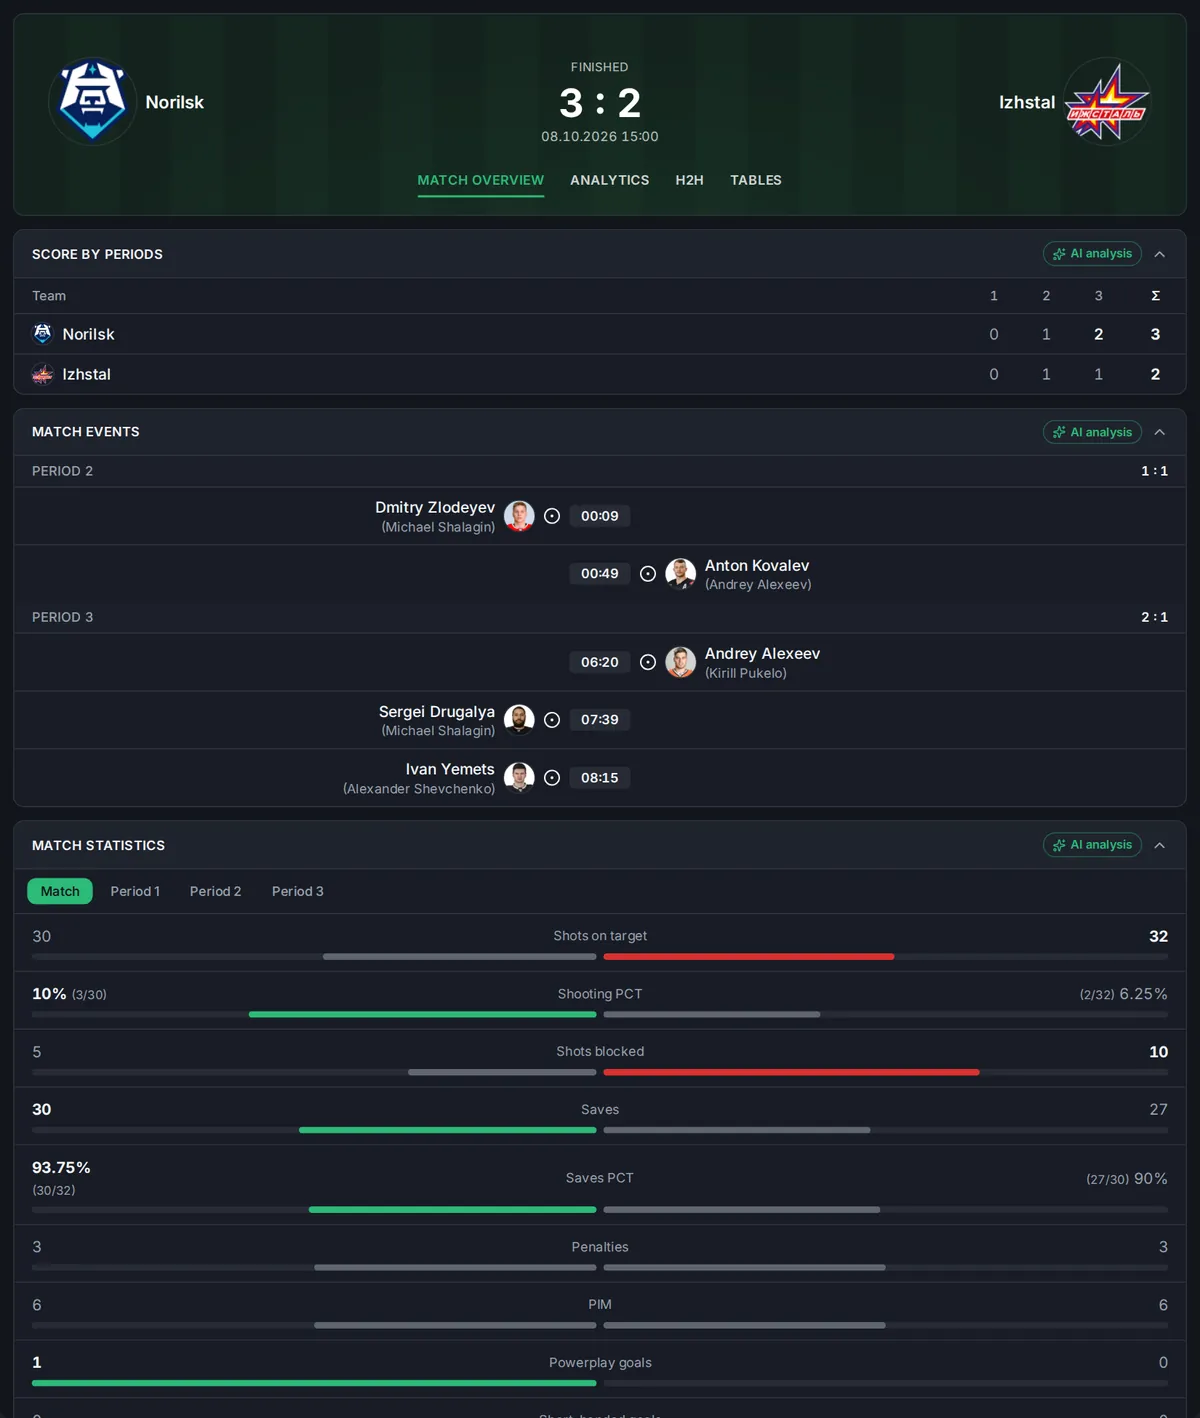
Ice hockey: lines and match report
Score by period, events, line combinations and the match report.
- Goals and penalties by period
- Team lines
- Match statistics
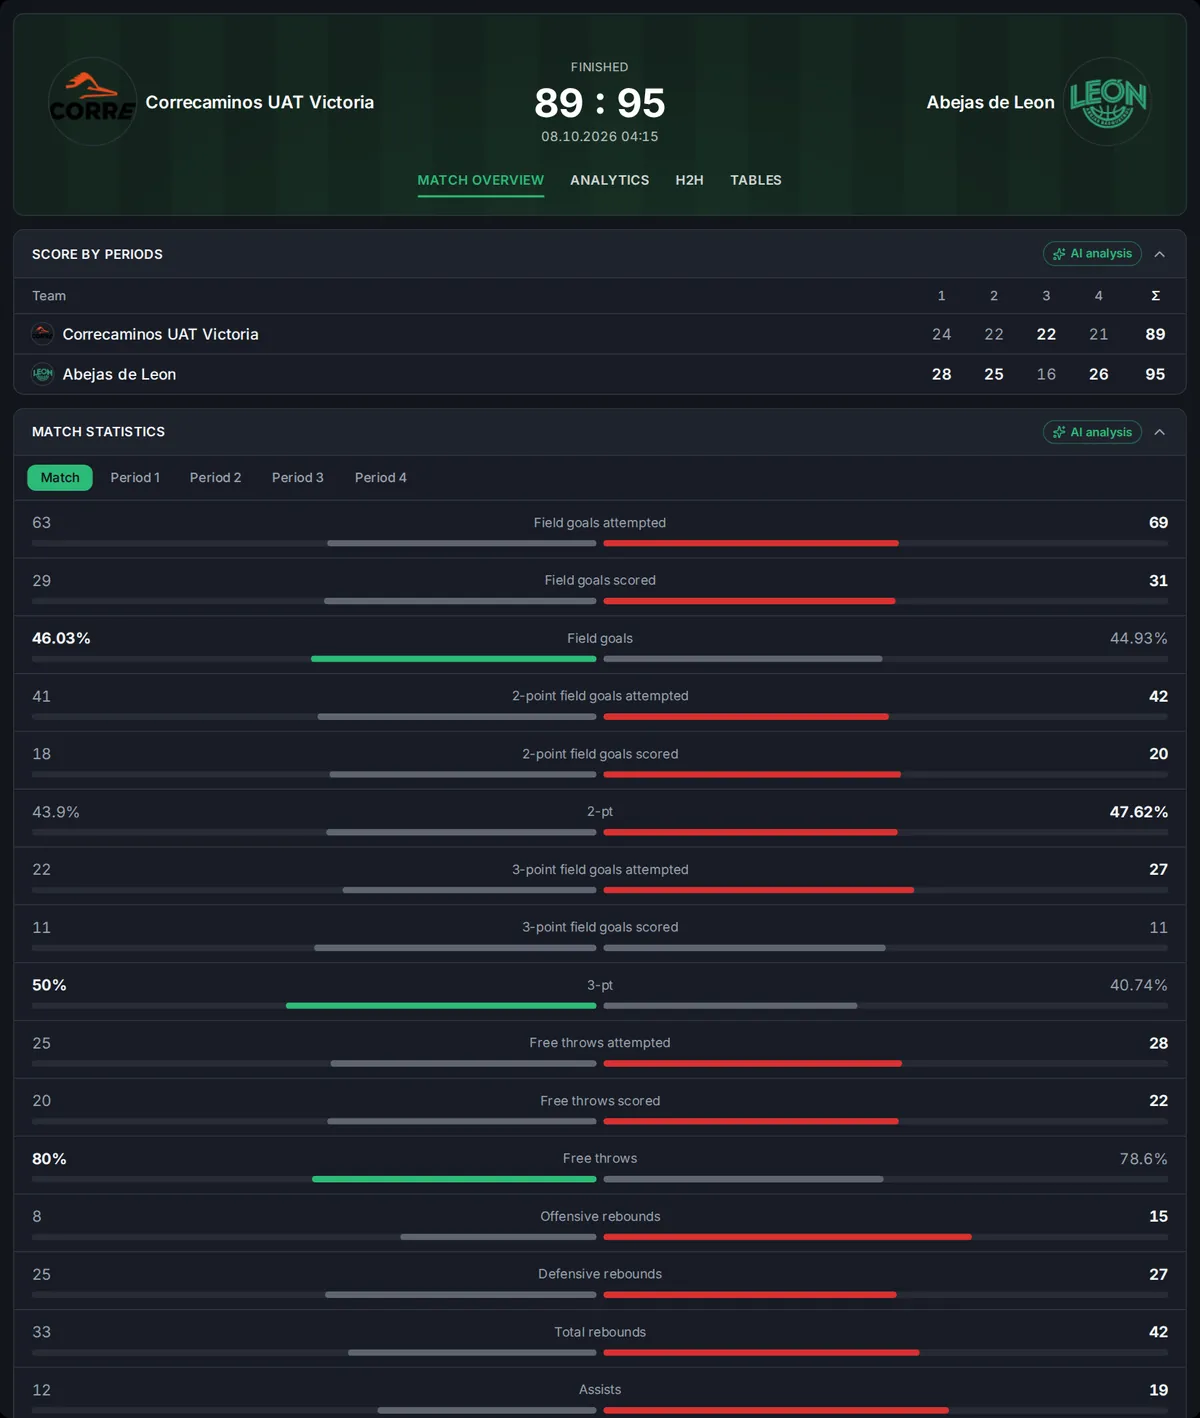
Basketball: quarters and box score
Score by quarter and detailed team statistics.
- Points by quarter
- Rebounds, assists, shooting
- Team comparison
Who gets the most out of the widget
One widget, four use cases. Readers stay on your site longer and come back for every match.
Sports media and blogs
A match center next to every news story and preview: stats, line-ups and live commentary without your own development.
Tipsters and Telegram channels
Ready-made analytics for every match: probabilities, fair odds, trends and AI analysis.
Betting affiliates
Useful content next to your affiliate offers keeps visitors on the page longer.
Sportsbooks
A match center next to your odds: players see stats and forecasts without leaving for third-party sites.
Build your widget
Pick a screen, theme and mode — the embed code updates instantly. You get your key after you apply; it is tied to your domain.
This is sample code: we will send you the widget address and your key after you apply. The widget interface is available in 36 languages. It only works on the domains listed in your license.
A match center alongside your odds
The statistics widget complements other SportAPI products. Together they cover everything a player wants to see next to a bet.
Stats and predictions
This widget: today's matches, statistics, analytics and AI analysis. Analytics can also be connected separately.
Predictions & analytics →Sports statistics widget pricing
Every plan includes all screens, analytics and predictions, dark and light themes, compact mode and 36 languages. The only difference is the number of sports.
Try the widget on your own site.
- 1 sport of your choice
- All screens and analytics
- Ads are shown in the widget
For sites about a single sport.
- 1 sport of your choice
- All screens and analytics
- No ads
For multi-sport media and sportsbooks.
- All 16 sports
- All screens and analytics
- No ads
Three steps to the widget on your site
Once you have your key, setup takes a few minutes.
- 01↓ →
Apply
Tell us your domain and sport — we will send a key tied to your site.
- 02↓ →
Build the widget
Choose a screen, theme and mode in the builder above and copy the code.
- 03
Paste the code
Add one line to your page or site template — the data updates on its own.
Questions about the statistics widget
Sports statistics widget for websites: what it does and how to choose one
A sports statistics widget turns an ordinary page into a match center. Readers see the score, events, line-ups and match numbers right on your site instead of leaving for a third-party live score service. For a site owner that means more time on page, more return visits and a reason to come back for every round.
How the SportAPI widget differs from a basic live score feed
Most free widgets show a score and a table. The SportAPI widget adds what people actually read sports sites for: expected goals (xG) and expected goals on target (xGOT), detailed match stats, line-ups and formations, live text commentary and each team's playing style. A separate analytics screen calculates outcome probabilities, fair odds, the correct score by the model, totals and trends.
11 screens: from the match feed to the playoff bracket
The widget is not a single table but a set of screens your readers move between on their own: today's match feed with a calendar and search, the match page, analytics, head-to-head, team and player pages, the league table with a results grid, the knockout bracket and dedicated screens for tennis, ice hockey and basketball. You can embed the whole widget or just the screen you need — for example, a match page inside a news story and the standings in a league section.
16 sports in one widget
Football, ice hockey, basketball, tennis, volleyball, handball, baseball, table tennis, futsal, beach soccer and beach volleyball, Formula 1, Australian rules football, snooker, cricket and kabaddi. You do not need a separate service for each sport: one sport costs $50 per month, and all sports cost $400 per month.
Match analytics with AI breakdowns
The forecast comes from SportAPI's own model built on team statistics. Next to it you see the history: how often each line has landed for each team. The AI analysis describes the teams' strengths, weaknesses and style of play. It is ready-made content for tipsters, Telegram channels and betting affiliates, with no manual preparation for every match. If you only need the analytics, you can get them on their own — see the match predictions and analytics widget.
How to embed the widget
The widget is added to any CMS with one line of code. Choose a screen — today's matches, a match, analytics, a team or standings — plus a theme and a mode. Compact mode fits narrow columns and mobile, and the interface is available in 36 languages. The key is tied to your domain, so the widget cannot be copied to someone else's site.
What the widget does for your site
Stats next to your articles keep readers on the page: instead of opening a live score app in another tab, they browse line-ups, trends and the table on your site. Every new round is another reason to come back. The data updates automatically, so your editors never have to fix scores and tables by hand after each game.
For sportsbooks — together with your odds
If you run a betting project, the statistics widget works alongside the sports odds API, the 3D match tracker and live video streams. Players see odds, stats and predictions in one place. If you need a complete results website, see the turnkey live score site, and if you need the data itself, see the match results API.
Start with a free month on one sport: install the widget, watch how your readers respond and move to an ad-free paid plan when you are ready.