

Match predictions and analytics powered by AI
A ready-made widget for your website: outcome probabilities, fair odds, correct score, totals, trends and AI analysis for every match. One line of code and no manual preparation.
- Probabilities and fair odds
- Totals, corners, cards
- AI match analysis
- 36 interface languages
What your readers get for every match
Not a dry table but a ready-made breakdown: model numbers, team history and conclusions in plain language.
Outcome probabilities
Home win, draw, away win as percentages, plus expected goals, corners and cards.
Fair odds
Probability converted into odds without a bookmaker margin. Makes it easy to compare the model's estimate with the bookmaker's line.
Correct score by the model
The most likely scorelines and the chance that a team scores four or more.
Model vs. history
For every total line, the model's estimate next to how often the line came in for each team.
Goals by time and first goal
When a team scores and concedes, and what happens after the first goal.
AI analysis
Team strengths and weaknesses, playing style and what to expect from the match — in text any reader understands.
One match's analytics — exactly as your readers will see it
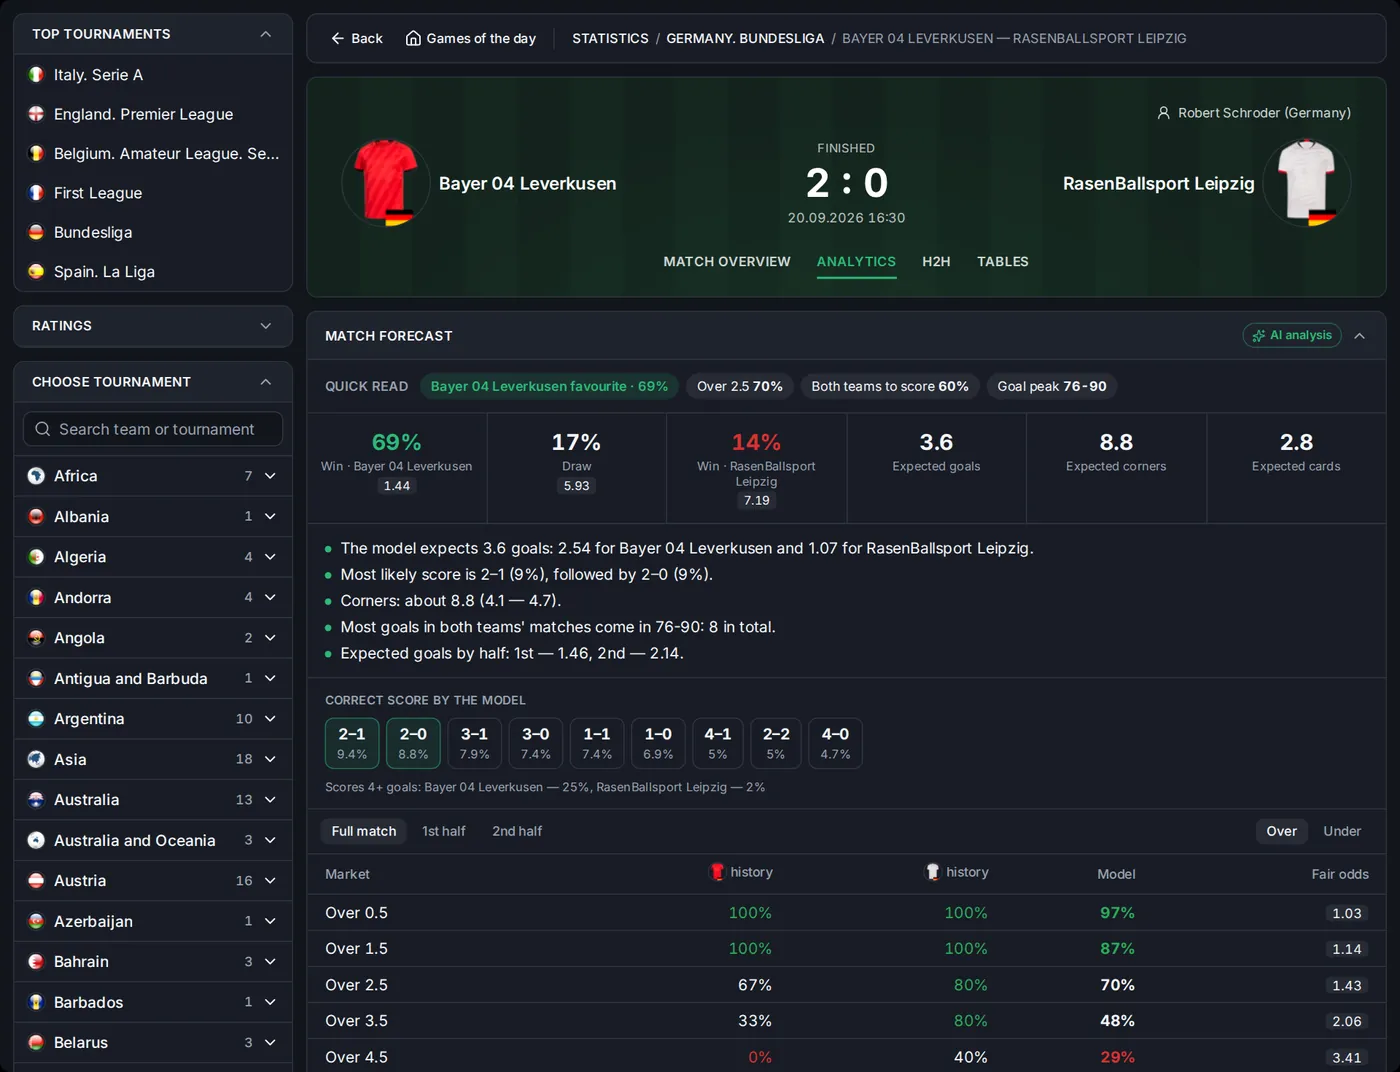
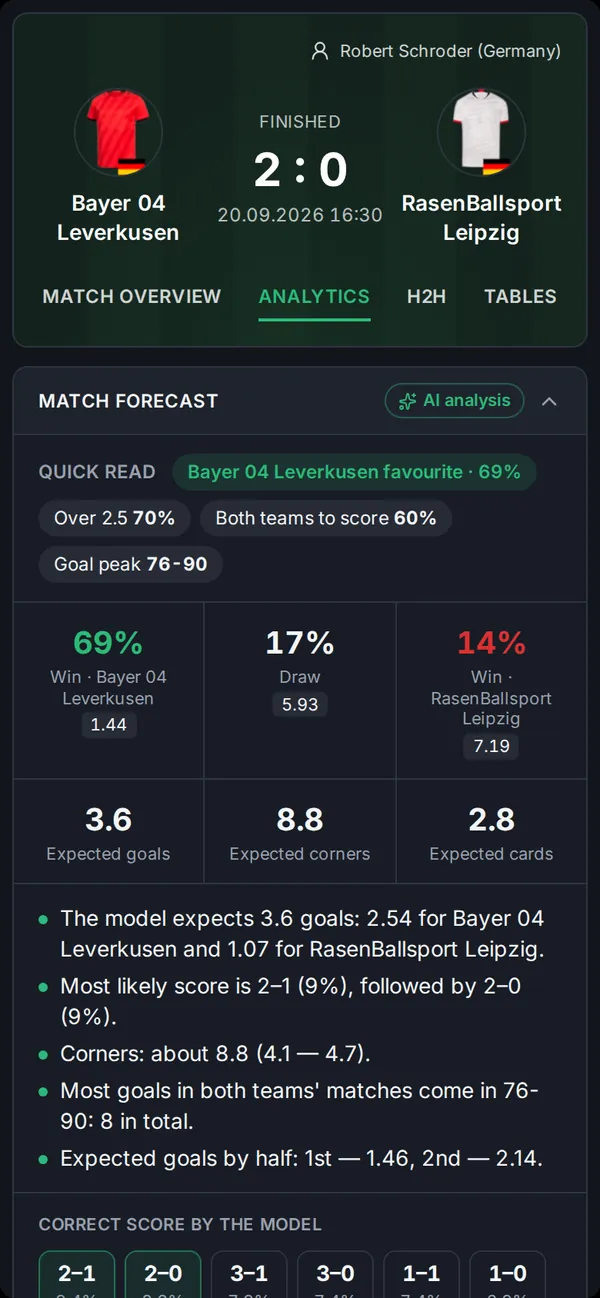
Data from the widget: Bayer Leverkusen vs RB Leipzig, Bundesliga, 20 September 2026. The widget prepares this breakdown for every match in its feed.
| Market | history | history | Model | Fair odds |
|---|---|---|---|---|
| Over 0.5 | 100% | 100% | 97% | 1.03 |
| Over 1.5 | 100% | 100% | 87% | 1.14 |
| Over 2.5 | 67% | 80% | 70% | 1.43 |
| Over 3.5 | 33% | 80% | 48% | 2.06 |
| Over 4.5 | 0% | 40% | 29% | 3.41 |
History — share of each team's recent matches where the line came in: Leverkusen at home, RB Leipzig away. Model — SportAPI's estimate.
- 33% 1–15 80%
- 67% 16–30 0%
- 0% 31–45 40%
- 33% 46–60 40%
- 100% 61–75 20%
- 33% 76–90 80%
% — share of matches with a goal in the period. Leverkusen — home matches, RB Leipzig — away matches.
- Leverkusen score most often in the 61–75 minute window: 3 of 7 goals (43%).
- Leverkusen score 57% of their goals after the 60th minute.
- RB Leipzig score most often in the 76–90 minute window: 4 of 9 goals.
- 67% 2/3 Scores first 1/4 25%
- 100% 2/2 …and wins 1/1 100%
- 33% 1/3 Concedes first 3/4 75%
- 100% 1/1 …and then scores 3/3 100%
- 100% 1/1 …and comes back to win 0/3 0%
- 67% 2/3 Scores in both halves 1/5 20%
- At home, Bayer Leverkusen opened the scoring in 67% of matches and won all of them.
- Away, RB Leipzig always hit back after conceding first, but lost every one of those matches.
- 2.76 xG for 2.94
- 0.65 xG against 1.80
- 19.0 Shots 21.0
- 9.0 Shots on target 7.5
- 14% Conversion rate 9%
- 7.1 Shots per goal 11.7
- Leverkusen concede 0.32 goals per match fewer than their opponents' xG.
- RB Leipzig score 1.14 goals per match fewer than their own xG — they aren't converting their chances.
- B Leverkusen scored in 8 matches in a row 100%
- L RB Leipzig: over 2.5 in 6 matches in a row 100%
- B First-half goal in 8 of 8 matches 100%
- B Over 2.5 goals in 7 of 8 matches 88%
- Will score from a through ball Likely
- Will create many scoring chances Likely
- Biggest strengths: set pieces and attacks down the wings Very strong
Data from the SportAPI widget. The forecast is an estimate from SportAPI's own model, not a guaranteed outcome. The final score of 2:0 was the model's second most likely scoreline.
What the analytics look like in the widget
Real screenshots of the widget. Match forecasts are available for football, ice hockey and tennis.
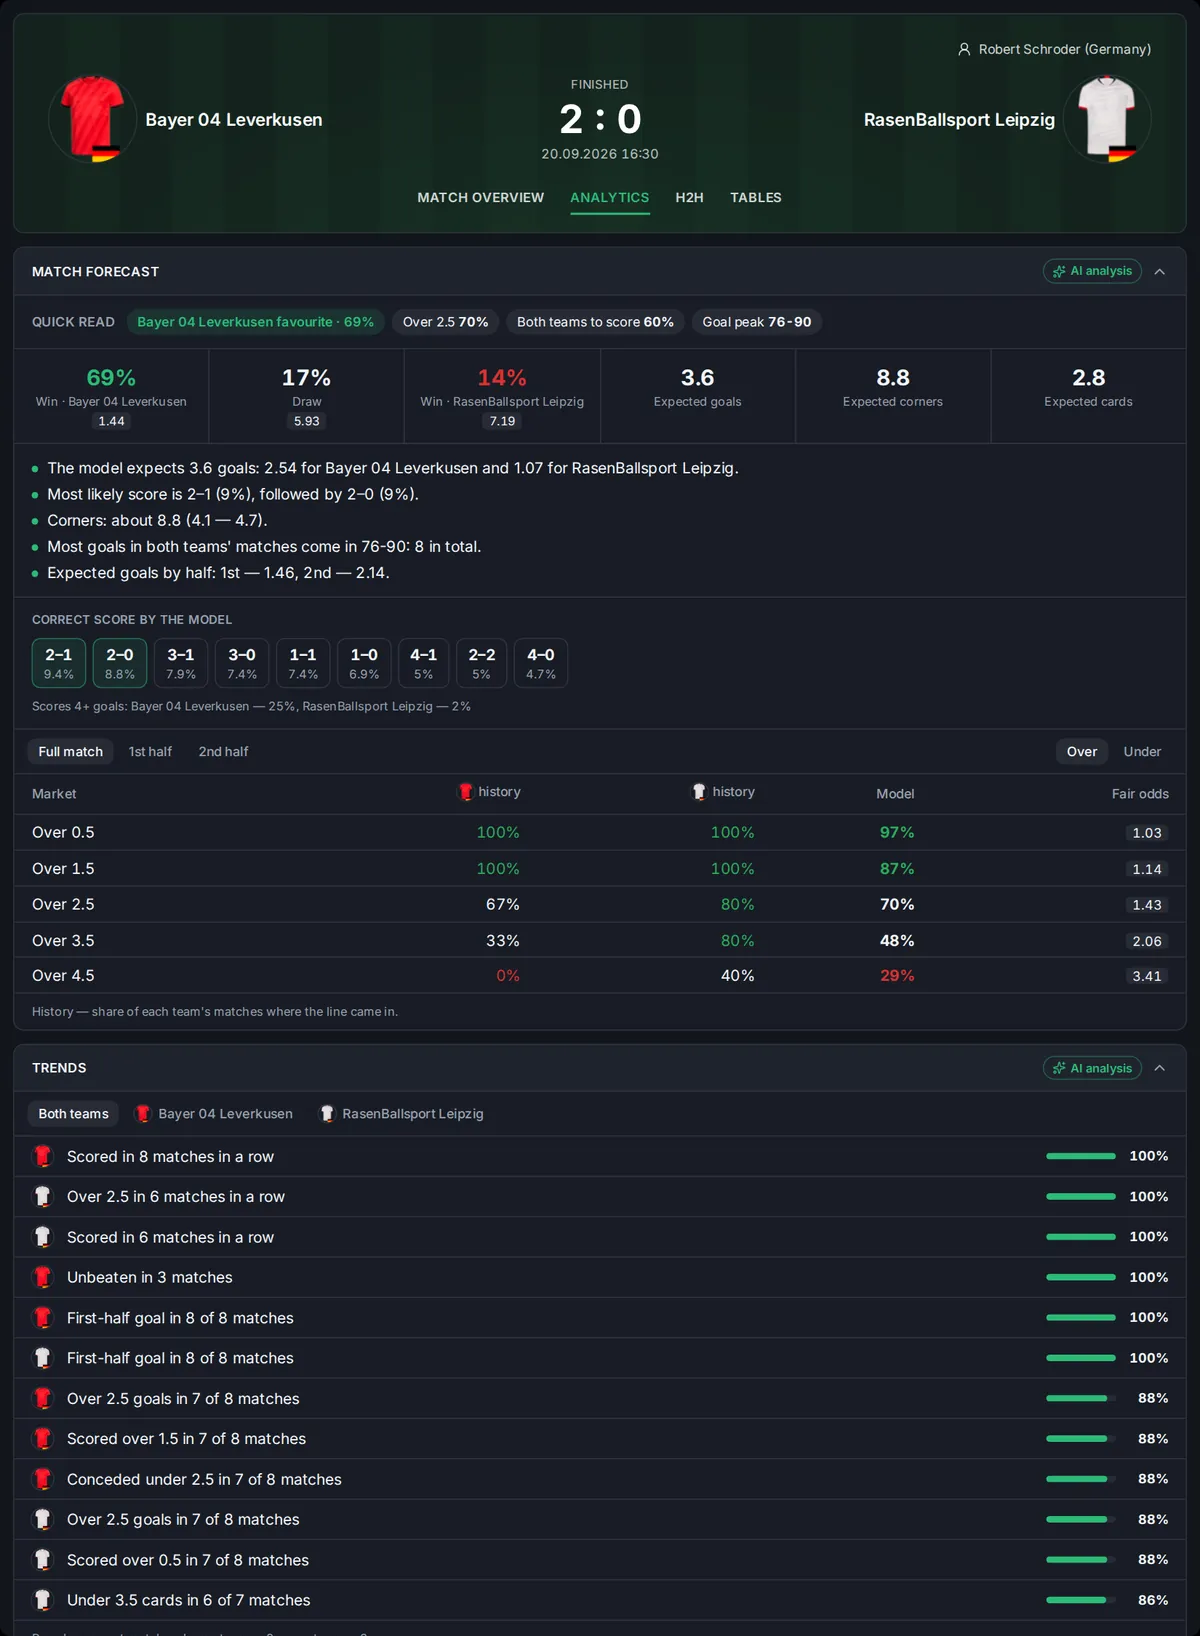
Football match forecast
Quick read, outcome probabilities and fair odds, correct score, totals by half, markets from recent matches, corners and cards, xG and half-time/full-time.
- Model vs. history for every line
- Goals by time and first goal
- Corners, cards, handicap
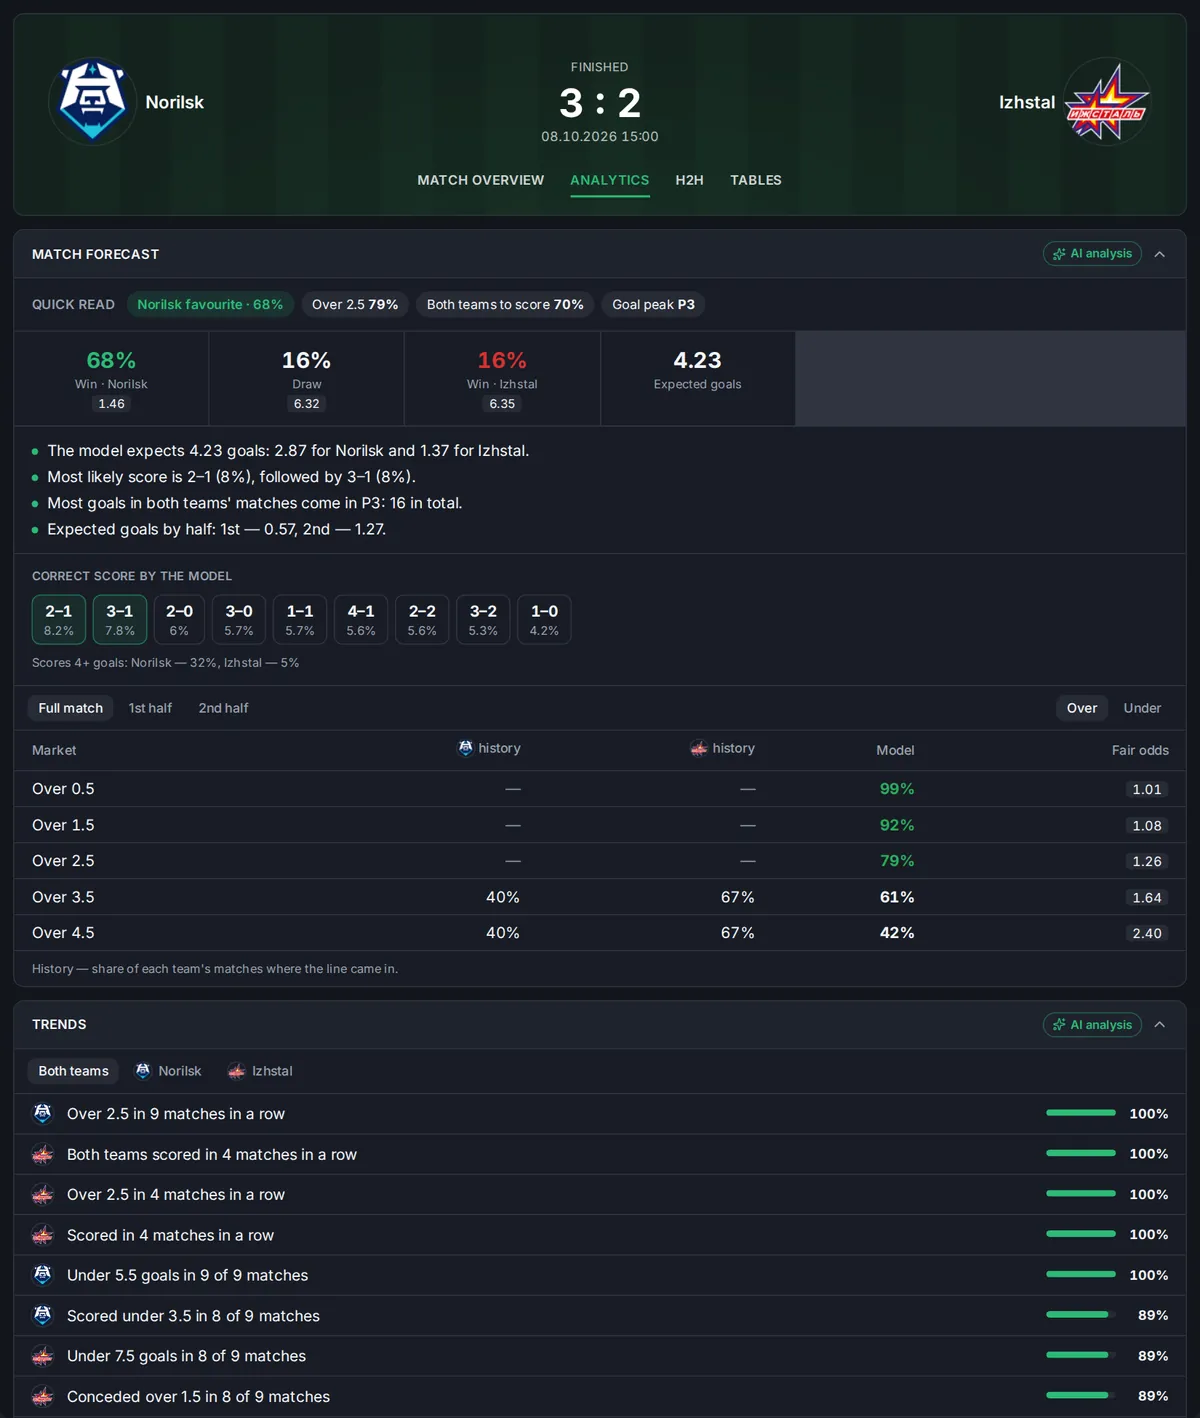
Ice hockey match forecast
Outcome probabilities including a regulation-time draw, expected goals, correct score and totals.
- Favorite and probabilities
- Expected goals for each team
- Goal peak by period
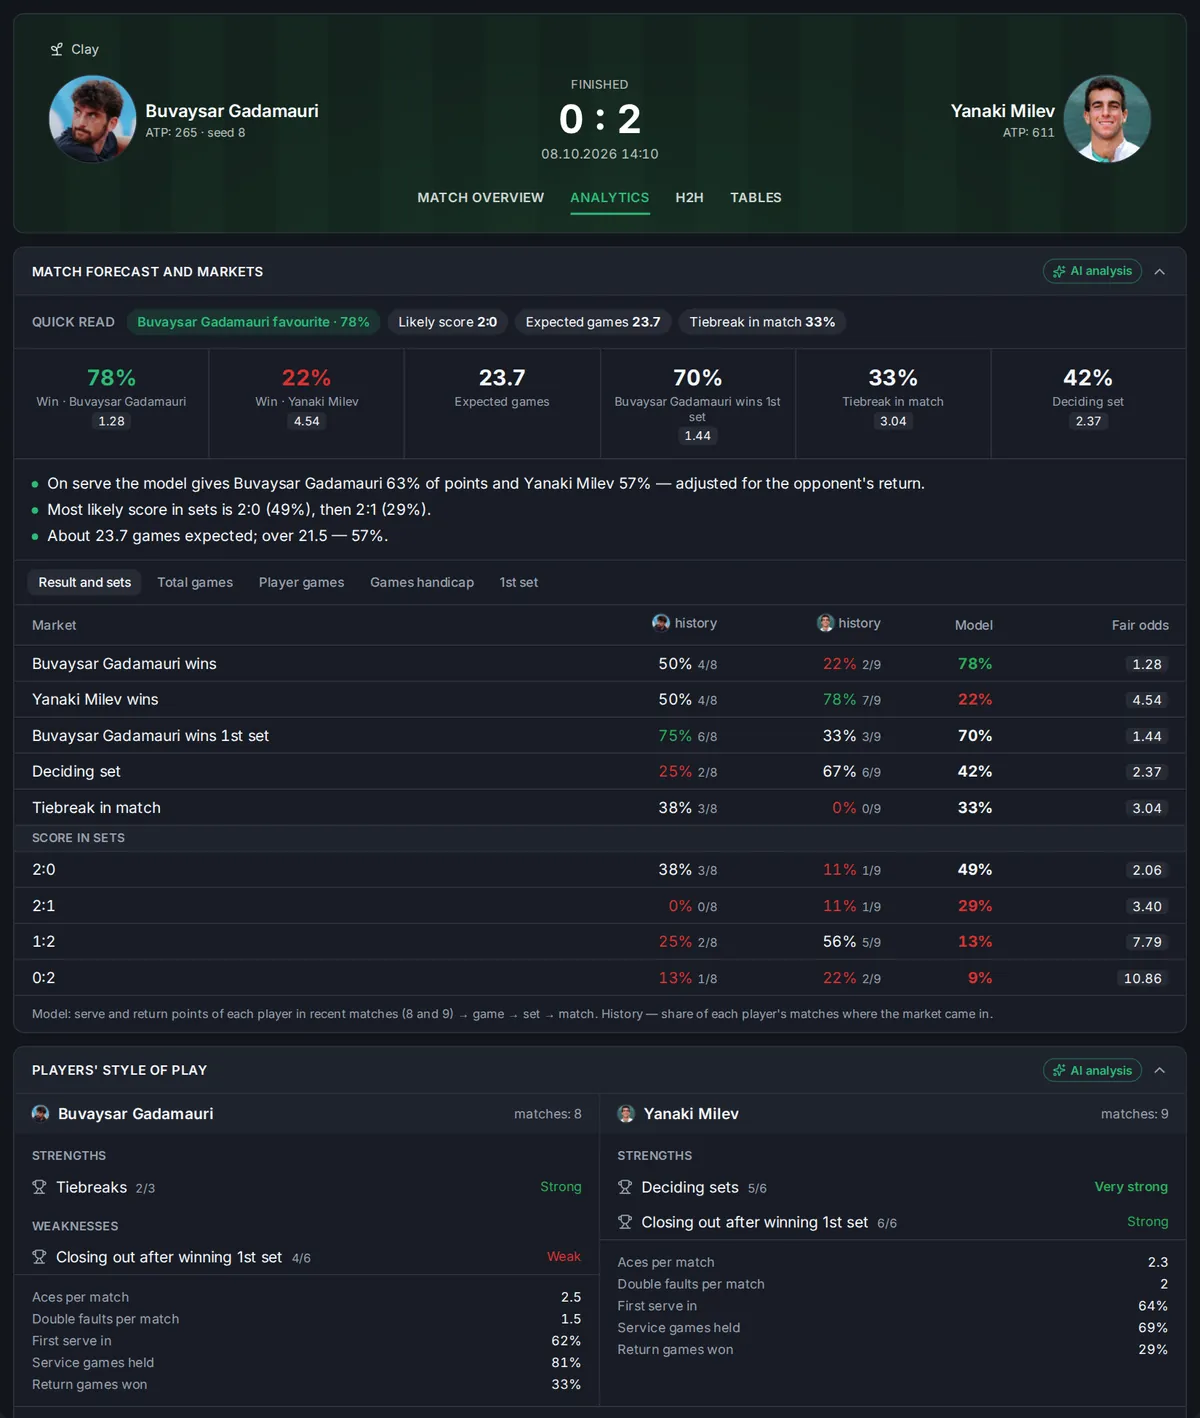
Tennis match forecast
Win probability and set scores, game totals, tie-breaks and each player's style of play.
- Match win and set scores
- Game totals and tie-breaks
- Serve and return
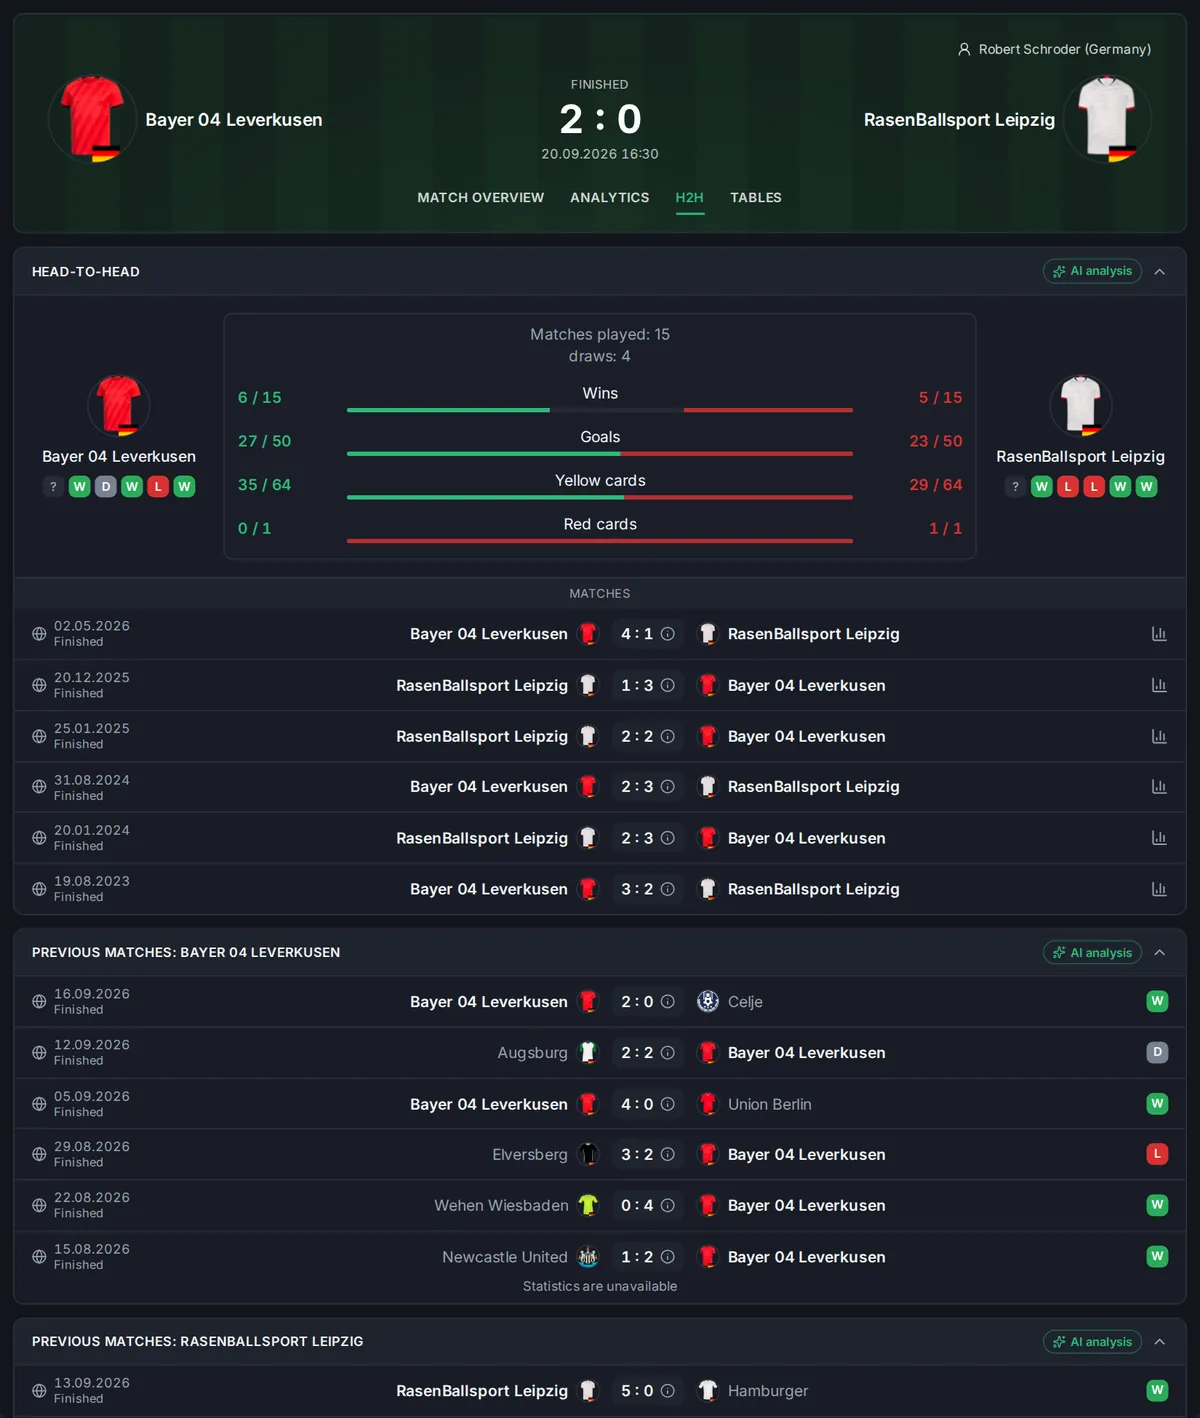
Head-to-head
Previous meetings and markets in head-to-head matches — one more input for a prediction.
- All head-to-head matches
- Goals and totals in direct meetings
- Recent form
Who needs predictions and analytics on their site
Analytics works best where readers are making a decision and looking for evidence.
Tipsters
Model numbers next to your tip: probabilities and fair odds back up your pick.
Telegram channels
A link in your post leads to a match page with analytics — subscribers see the numbers, not just your conclusion.
Betting affiliates
Analytics next to your affiliate link keeps visitors on the page and gives them a reason to return for the next round.
Sports media
Match previews with the model's forecast and trends — without an analyst working on every article.
Predictions on your site in three steps
Once you have your key, setup takes a few minutes.
- 01↓ →
Apply
Tell us your domain and sport — we will send a key tied to your site.
- 02↓ →
Choose the Analytics screen
Set the theme, mode and language in the builder on the statistics widget page.
- 03
Paste the code next to your tip
One line of code in a match preview or on your predictions page — the analytics update on their own.
Predictions and analytics pricing
A separate plan for the analytics and predictions screen only. Need today's matches, line-ups and standings too? Get the full statistics widget.
Try the analytics on your own site.
- 1 sport of your choice
- Match predictions and analytics
- Ads are shown in the widget
For example, football only.
- 1 sport of your choice
- Match predictions and analytics
- No ads
For multi-sport projects.
- All 16 sports
- Match predictions and analytics
- No ads
Questions about predictions and analytics
AI match predictions for your website: what analytics give you and how to connect them
AI match predictions are about more than "who will win". Readers of a sports site want to understand why: what chances each team has, how many goals to expect, how the teams play in different periods of the match and what their recent games say. The SportAPI analytics widget answers these questions with numbers and plain text — for every match, with no manual preparation.
Probabilities and fair odds
For every match the widget shows the probabilities of a home win, a draw and an away win, plus expected goals, corners and cards. Next to them are fair odds: the probability converted into odds without a bookmaker margin. Readers can compare the model's estimate with the bookmaker's line for themselves. The correct score by the model shows the most likely outcomes of the match.
Model vs. history
Model numbers are easier to trust when history sits next to them. For every total line, the widget shows how often the line has landed for each team in recent matches — and the model's estimate alongside. A gap between the model and the history is a ready-made topic for a tip or a post.
Goals by time, first goal, trends
The analytics show in which periods teams score and concede, how often they open the scoring and what happens after the first goal, and which streaks the teams are on. Separate blocks cover xG and shots, corners and cards, half-time/full-time and the most common scorelines. That is enough for a detailed preview of any round.
Football, hockey and tennis
Match forecasts with probabilities are available for football, ice hockey and tennis. In hockey, the model accounts for a regulation-time draw and shows each team's expected goals and the goal peak by period. In tennis, you get the win probability, set scores, game totals and tie-breaks. For other sports, the widget shows the analytics blocks that are available, such as team trends.
AI match analysis
The AI analysis describes the teams' strengths and weaknesses, their playing style and what to expect from the match. It is text any reader understands, and you do not have to write it by hand for every game. We do not disclose the calculation methodology: predictions come from SportAPI's own model built on team statistics.
How to use analytics in your content
Tipsters place the widget under their write-up, so readers see not only the author's pick but also the numbers behind it. Telegram channels link to a match page with analytics, which brings subscribers to the site instead of keeping them in the messenger. Sports media add the block to round previews, and betting affiliates add it to match reviews so visitors stay on the page longer and come back for the next round.
Who it is for and how to connect
The widget suits tipsters, Telegram channels, betting affiliates and sports media. You can connect analytics on their own — from $20 per month for one sport and $160 for all sports — or as part of the sports statistics widget with today's matches, line-ups, standings and H2H; setup takes one line of code. Predictions are available for football, ice hockey and tennis. If you need a complete predictions website, see the turnkey sports predictions website, and for betting projects, the sports odds API.
A forecast is a model estimate, not a guaranteed outcome. Start with a free month on one sport and see how your readers respond to analytics next to your content.